Original version in Dutch: Dagenlang geen signaal. Alleen de dolfijnen geven antwoord – NRC
Author Archives: Admin
Research Scientist in Physical Oceanography at Georgia Tech
A research scientist position in physical oceanography is available at the School of Earth and Atmospheric Sciences at Georgia Tech. The research scientist will work collaboratively on a number of projects focused on the Atlantic Meridional Overturning Circulation (AMOC). Specifically, the research scientist will work closely with Dr. Susan Lozier, the international lead for the Overturning in the Subpolar North Atlantic Program (OSNAP; (www.o-snap.org) on research projects related to AMOC variability. Additionally, the research scientist will work closely with postdoctoral researchers in Dr. Lozier’s lab and coordinate communication among the OSNAP international and national partners.
Job Responsibility: The individual will be expected to conduct high-quality research in physical oceanography; produce all OSNAP metrics and data products; publish papers; and present work at national and international conferences. The researcher will also work collaboratively with oceanographers at Georgia Tech and elsewhere on projects related to OSNAP. Opportunities for cruise participation as part OSNAP will be available.
Qualifications: A PhD in physical oceanography or a related field is required, as is at least two years of post-PhD research experience. A background in large-scale oceanography is preferable and experience with observational and model data sets is desirable. Excellent organizational and collaborative skills are required and strong oral and written communication skills are expected.
Start date: On or about January 1, 2025.
Salary: Commensurate with the individual’s experience and education.
To apply: Interested individuals should send a CV, a one-page statement of research interest, and the names and contact information of at least 3 references to Anne-Sophie Fortin at afortin3 at gatech dot edu. Review of applications will begin immediately and continue until the position is filled.
Georgia Tech, an institution of the University System of Georgia, is an equal education/employment opportunity institution and will not discriminate against any employee or applicant on the basis of age, color, disability, gender, national origin, race, religion, sexual orientation, veteran status, or any classification protected by federal, state, or local law and requires compliance with the Immigration Control Reform Act of 1986. Consistent with its obligations under federal law, each company that is a federal contractor or subcontractor is committed to taking affirmative action to employ and advance in employment qualified women, minorities, disabled individuals and veterans. Candidates with the skills and knowledge to productively engage with diverse communities are encouraged to apply.
Posted in Job Opportunities
Final week from the RV Armstrong
by Femke de Jong
Today we steam for Iceland. After four weeks of mooring operations and CTDs even those among us who are always looking for more data are ready to go home. Part of it is mindset, we were prepared to work ourselves to the ground for four weeks to get this done and now it is done. Had we set out for six weeks I’m sure we would have continued tiredly, but motivated for another two weeks.
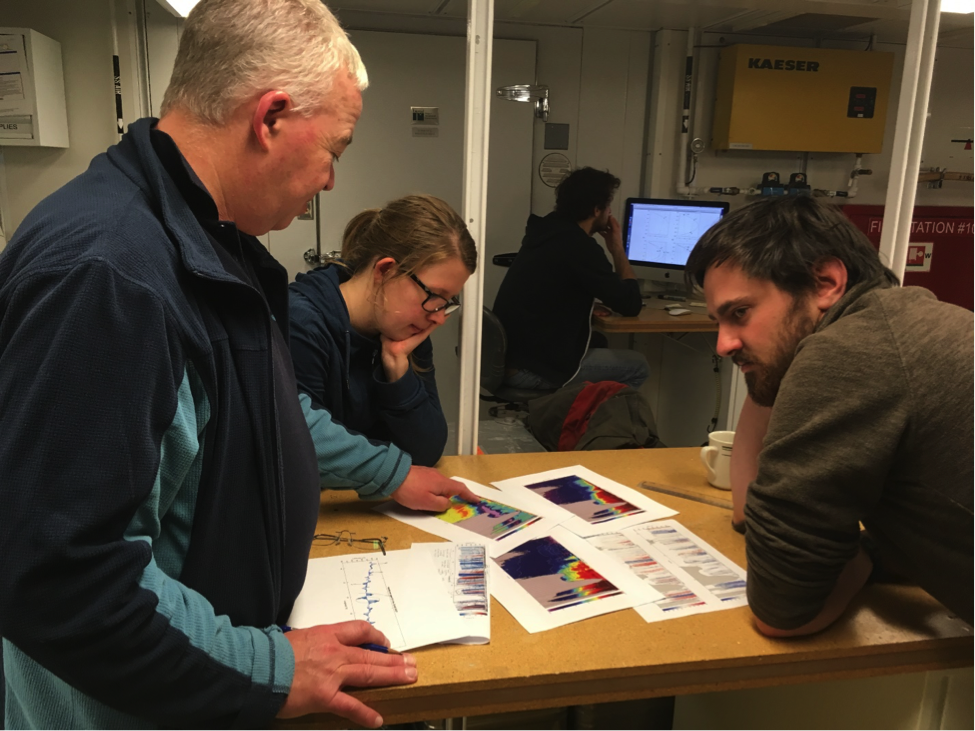
During these four weeks we recovered 19 moorings and deployed 19 new moorings in those same positions, plus one lander. The mooring teams of NOC, RSMAS and NIOZ worked together on each of these moorings. So while the PIs of the respective institutes had a break while another PI was overseeing his or her moorings, these guys worked continuously. From my workstation, which faced the CTD console with its many screen, I could nicely keep track of the progress on deck. While I was out there doing my own moorings it was good to have some more experienced people around who don’t panic when a mooring comes up in a tangle (oh, how I would have like to start recovering the line that held the instruments/data first…).
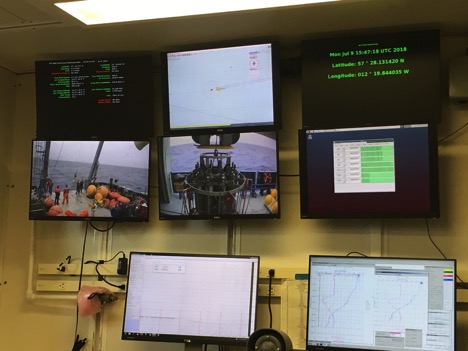
the screens of the CTD console. Keeping and eye on all the important stuff, position, ETA, CTD and deckwork.
Inside, we worked together to run the CTD watches. The day watch was allocated to the PI currently doing moorings/instruments. The night or zombie watch was divided between the others. Theoretically this requires “just” shifting your waking/sleep pattern by eight hours or so. In practice, you either completely loose contact with what’s going on during the cruise, because you show up just for dinner as the others are winding down from their day. I tried a different approach, being around more of the day. A short nap after my watch/breakfast, skipping lunch, and another nap between dinner and the start of my watch at midnight. While this allowed me to keep track of the ever changing plans, it did effectively turn me into a zombie for the time being. The cruise leader’s attempt to teach me the rules of cribbage directly went in one ear and out the other, without my mind having any chance to process the information. I wonder what else I might have missed…
But while we still had three watches, each covering eight hours of CTDs, the chemist team had to deal with 24 hour measurements with two people. So maybe it’s not too surprising I haven’t seen them much since they finished their work and were allowed to recover. I’m sure they’ll come out of their cabin once we get closer to Reykjavik.
At least we get to go home in a few days. Most of the Armstrong’s crew are staying on for another cruise. They have been very helpful and accommodating in our busy schedule and we’ve explained them the difference between the colored jerseys in the Tour de France. There was one unfortunately incident, where one crew went on a killing spree (playing the assassin game), but to be honest that whole thing was instigated by the some of the British participants.
All of us came together in our loathing of “weather” on this, somewhat lively, ship. An incoming wave attacked one of the folks attaching microcats to the CTD frame, they nearly lost one of the cats when were holding on (not quite) for dear life. A ladder of an upper bunk bed came off in the middle of the night and woke up the owners of the bed as well as those in neighboring cabins. After all, there is a reason why we spend our summers in the subpolar gyre… we would never have managed doing all of the above in winter. That time of year is much better spend analyzing all the data we collected, maybe next to a cozy fireplace.
Posted in Cruises
Spare Time
by Heather Furey
Well, this cruise has been singular – definitely the best weather for deployments and recoveries that I have experienced while at sea. I’ve been noticing the things folks do in their spare time. Every cruise is different; every cruise has a different feel to it. The different people and personalities and work experiences coalesce into a singular experience.
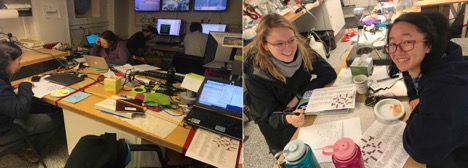
On this cruise, I have learned that I am not awful at crosswords! Every day, Collin Dodson prints out a stack of the most recent New York Times crosswords, and people work on them through the day.
Dave Wellwood has a disco ball in his salt lab, and music.
Keenan Foley has been trying to keep a stowaway bird alive by providing it a little bowl of water. We think it might be a juvenile Ringed Plover?
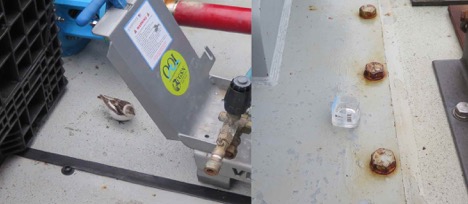
A stowaway bird (maybe a juvenile ringed plover?) has come out to visit for each mooring deployment. We think it has been on board since we left port. Keenan’s fresh water supply for the bird is pictured to the right.
The science party made cups to shrink, a tradition. Regular sized cups, when put under great pressure – as happened when being pulled deep underwater, will shrink to cups a quarter or so of their original size. We decorate cup with sharpies and tie them to the CTD rosette cage for a ride to the bottom of the sea.
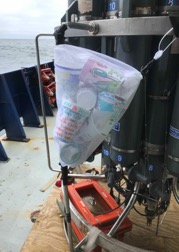
Decorated cups in a laundry bag, tie-wrapped to a rosette frame, ready to be brought to the bottom of the ocean.
And James Kuo has been working his rope skills. It’s James’ birthday today, and Eric made a special cake, James (an experienced winch operator) got to run the Lebus winch and drop the last anchor on the last deployment.
The OSNAP portion of this cruise is almost wrapped up. We have had four successful mooring deployments thanks to a great crew, and we have just one more sound source mooring to recover. It is time to savor the last few days at sea, the simple skyline. Time to get things documented and submitted, work out agent and shipping logistics, to dream of fresh green vegetables, and of heading home.
Posted in Cruises
Nature – News
Earlier this week many of the researchers and scientists involved in OSNAP presented their work, based on the first two years of continuous monitoring in the North Atlantic, at the Ocean Sciences Meeting in Portland, OR. While there are still a lot of implications and details forthcoming, Nature – News reported on these findings in a short summary linked below.
Posted in News
News on OSNAP results
by Feili Li
It seems to be a quiet year for OSNAP – just one OSNAP cruise took place last summer and so most of the moorings have stayed in the water for a year and a half. But OSNAP scientists have been working intensively on analyzing the first two years of data and we have started to obtain some very interesting results based on measurements from individual arrays. Some of those results were presented and discussed at a workshop held in Southampton, UK in early November (blog post). Much more is coming and will be presented at the Ocean Sciences Meeting 2018 in Portland, OR. Please stay tuned as we will soon publish a dedicated blog post with a list of all OSNAP-related presentations at OSM 2018.
In addition to analyses by individual groups, all OSNAP scientists have been working closely on the first data products from the full array. We are now in the process analyzing preliminary results and finalizing the flux estimates. Final products are expected to be delivered in spring of 2018. These final products include the overturning volume and associated heat and freshwater transport time series along with the cross-sections of velocity, temperature, and salinity (Figure 1 below shows the mean velocity and property fields at OSNAP). It is always worth mentioning that OSNAP is not an isolated program as our results are based on many existing observational efforts in the region (e.g., Argo, AVISO) and the results will be analyzed in coordination with ongoing programs (e.g., OVIDE, RAPID).
During the first two years of the OSNAP deployment, the subpolar North Atlantic experienced a widespread cooling with two successive intense winters (2014/15 and 2015/16). Strong air-sea heat fluxes during those two winters led to intensified deep convection with an enormously large production of Labrador Sea Water. All the changes make us wonder about any concurrent changes in circulations (overturning and gyre) at the subpolar latitudes. Once we have firmed up the flux estimates at OSNAP, we will soon begin the task of investigating those observed changes in the region and linking them to local and/or remote forcing mechanisms.
Next year sure will be a productive year for OSNAP – be prepared for exciting news!
Happy Holidays!
Back to school and starting-up the new modelling sensitivity studies
by Laura Castro de la Guardia
When I am ask by friends: What is it that I study? I generally give them the quick answer: I study biological-oceanography at the University of Alberta. But when they look-up “University of Alberta” on Google map for example (Figure 1), they always point out: there are no coastlines near the University of Alberta! In fact, the province of Alberta in Canada, has NO coastlines at all. So, how is it then, that I can study the oceans? Although one way will be to spend a lot of time travelling to either western, eastern or northern Canada to do my field work, I can also study the oceans from my own desktop at university!
I use a mathematical model on the computer to create a virtual ocean with some biology and chemicals; it is sort of like a video game, but the model attempts to be as realistic as possible. The core of the model is based on the most current understanding of physical and mathematical relationships that exist between the ocean, the atmosphere, the sea ice and the biology.
There are many models available. The ocean model I used is called NEMO (http://www.nemo-ocean.eu/) that comes together with a sea ice model LIM. The biological and chemical model I used is embedded within NEMO and it is call BLING (https://sites.google.com/site/blingmodel/). Cool names acronyms, right?! Both models are free to use by any user, but it requires some understanding of computing science, programing, and a very powerful computer. We have to run our model on super-computers that are shared across Canada (Compute Canada/Calcul Canada).
Unlike what you may have imagined from my video game analogy, the output of the model is not a movie, but lots of numbers (a.k.a simulated data). The “simulated data” is what I use to do statistical analysis of many different things, for example, I can see the current state of the ocean, or the sea ice, or the marine algae (phytoplankton). We can also make movies with the simulated data (e.g. http://knossos.eas.ualberta.ca/vitals/outcomes.html)
Although models are still not able to reproduce an identical ocean to our real ocean, one of many advantages of an ocean model is that I can study how one single event/phenomena/or property in the atmosphere affects my simulated ocean or biology. This type of studies are called sensitivity studies, and they are like experiments in a lab. This is important because in our current climate, many things are changing at once (for example in the Arctic Ocean, sea ice is decreasing, temperature is increasing, the rate of river flow into the ocean is larger, there is more rain, there are more storms during the autumn), but we only observe the response of the oceans to all changes. While with the model I can have the response of the model to all changes, but also the response of the phytoplankton to only one change (e.g. more storms during fall (Figure 2)). Depending on what I am studying, I can then answer which of all these changes is the most important, which one is the one I should be most concern with? These are the kind of questions I would like to focus on for my sensitivity experiments, because these questions can help us prepare for the changing future: e.g. they could help shape or guide the adaptive tactics and conservation programs.

Figure 2. A simulation with storms (a) compared to a simulations without storms (b). The differences between each panel shows the regions where the storms have a greater impact on phytoplankton.
Posted in News
OSNAP Challenge
We want to bring everyone’s attention to the launch of the OSNAP Challenge located on this site under News and Events. Anyone is welcome to submit a prediction (or technically a hindcast because the data have already been collected) for the first two years of AMOC data from the OSNAP line. This contest is similar to the one organized by the RAPID program last year but in this contest there are no past observations of the AMOC from the OSNAP line so the level of difficulty is higher!
We are going to open up this blog to write-ups of the methods from each prediction and will be announcing the winners here in the Spring. The deadline for the submissions is April 1st. For more information including instructions on how to submit a prediction and how the submissions will be judged, see the site here.
We wish everyone luck and may the best model win!
-Nick
Posted in News
Structure of currents and their transport in the eastern Subpolar North Atlantic
By Elizabeth Comer
As part of the OSNAP array, the Extended Ellett Line (EEL) is a repeat hydrographic section that crosses between Iceland and Scotland. This line measures part of the Atlantic Meridional Overturning Circulation in particular capturing the majority of warm water flowing northwards from the Atlantic into the Nordic Seas and around half of the returning cold deep water (Figure 1). The heat that is transported northwards is released along its journey transferring heat and moisture to the atmosphere. The amount of heat being carried determines how much is released, therefore making it an important factor in climate predictions. By making measurements along the EEL we can investigate the currents’ structure and long-term changes in heat and freshwater transport. The EEL provides the perfect platform for investigating the heat and freshwater changes over time through its yearly measurements over 40 years.

Figure 1. A schematic of the Atlantic Meridional Overturning Circulation (Curry and Mauritzen, 2005).
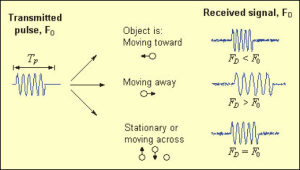
The EEL has measured velocity from the ocean’s full depth using an instrument called the Lowered-Acoustic Doppler Current Profiler (LADCP). This instrument is lowered through the water column and relies on the changes in return frequency of acoustic pulses to determine the water’s speed (Figure 2). The LADCP data is an exciting chance for us to see the in-situ velocity of the entire water buy valtrex australia column. Combining this velocity and hydrographic salinity and temperature measurements from each survey will provide the heat and freshwater transports across the EEL.
This is the research that I am currently carrying out and alongside this I will be taking part in the 2016 EEL research cruise, which requires being at sea for a month. So far, I have only been on weekly length research cruises so this will be a first and exciting experience for me. I am not only looking forward to collecting and processing my own data, but joining in with other scientists and learning new methods of data collection. Another first for me will be attending the Ocean Sciences Conference in New Orleans this February. This will be a great opportunity for me to meet researchers in my field, share experiences with other early career scientists and gain feedback on my research. These experiences will both not only enhance my learning, but build my confidence when explaining my research to different audiences.
Posted in News
Predicting the next 18 months of the AMOC at the RAPID line with a statistical model
by Nick Foukal, graduate student at Duke University
As the RAPID team prepares to release the next 18 months of AMOC measurements from the mooring array at 26°N, I have been busy building a statistical model to predict those observations. Statistical models extrapolate into the future using data on past states of the system and differ from physical models in that there is no dynamical constraint placed on the predictions. Whereas physical models might demonstrate how the AMOC responds to wind and air/sea buoyancy fluxes and build predictions based on that information, statistical models only need to know what the system has done in the past to predict the future. So in many ways, statistical models are not as useful as physical models; they cannot tell you why a system behaves the way it does, or how future changes to the environment may affect the system, but oftentimes statistical models can tell you the minimum amount of information you need to make accurate predictions.
Another useful trait of statistical models is that they provide a baseline metric from which to judge the performance of physical models. Weather forecasting is an example of this: until advances in computational capability and the advent of continuous satellite measurements improved the numerical weather forecasting models, the best-performing weather forecast models were statistical models. My goal in this project is to evaluate where oceanography is on the journey toward predictive skill: can physical models outperform a relatively simple statistical model in predicting the next 18 months of the AMOC?
State-space analysis is one of many ways to build a statistical model. The basic tenet of the state-space model that I use here is that the future state is a function of the current state. This type of state-space analysis also requires stationarity in the system, thus trends or oscillations with periods longer than the period of measurement must be removed. In addition, autocorrelation and known oscillations at periods shorter than the period of measurement should also be removed (if the oscillations are assumed to be stationary into the future) so that the state-space model can focus on the ‘unpredicted’ aspect of the data.
Given these requirements, I downloaded ten years of RAPID data (April 2004 – March 2014) at 12-hourly resolution, averaged the data to 10-day resolution due to the 10-day time scales of flow compensation between the upper and lower limbs of the AMOC as reported in Kanzow et al. [2007], calculated the integral auto-decorrelation time scale (36 days) and then averaged the data at 40-day resolution to produce a time series of independent observations. To remove the seasonal cycle, I calculated a continuous seasonal climatology (Fig. 1) by taking a 30-day running mean of the data padded with the December data at the beginning and the January data at the end. This padding ensured that the climatology was not biased by when the year began and ended and the running-mean ensured that the climatology was a continuous function rather than based on monthly means.
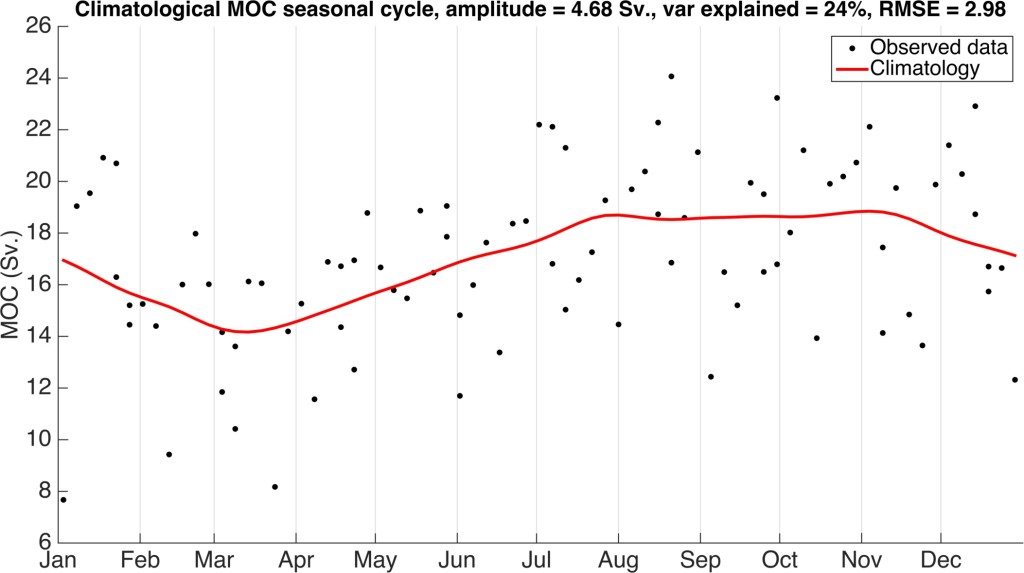
Figure 1. The climatological seasonal cycle of the RAPID AMOC data (2004-2014). The seasonal cycle has an amplitude of 4.68 Sv., RMSE of 2.98 Sv. and explains 24% of the variance in the data. The minimum occurs in March and there is a broad maximum from July through November.
To analyze trends or oscillations beyond the study period, I fit the data with five models: a linear trend line, a step-function with the mean from April 2004 to April 2008 and the mean from May 2008 to March 2014 (based on results from Smeed et al. [2013]), two linear trend lines for the same time periods as the step function, a quadratic fit, and a sine curve. The fit with the lowest RMSE is the sine curve (Fig. 2).
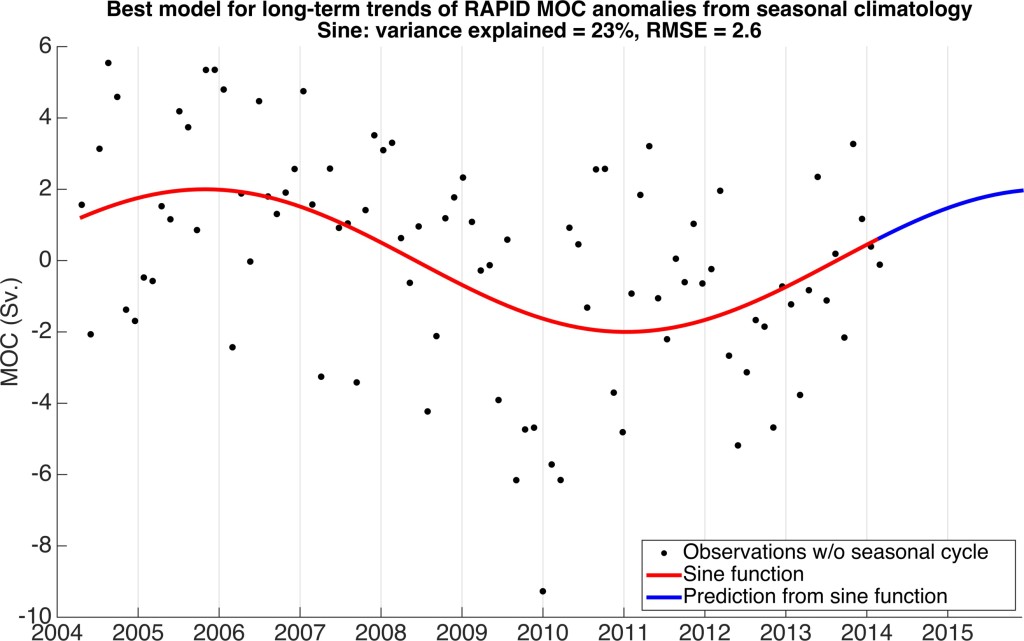
Figure 2. The sine curve fit to the AMOC observations without the seasonal climatology. The sine curve has an amplitude of 2 Sv., period of 10.41 years and phase shift of 6.16 years. This sine function has the lowest RMSE (2.6 Sv.) when compared to a linear fit, a step function fit (2004-2008 and 2008-2014), a quadratic, and two linear fits (2004-2008 and 2008-2014). The maximum of the sine curve occurs at the end of October 2005 and the minimum occurs in early January 2011. The next maximum predicted by just this component is in the Spring of 2016 while the most recent inflection point occurred in mid-2013.
To predict the AMOC signal that remained after the seasonal and long-term oscillations were removed, I fit the parameters of a state-space model to the ten years of anomalies (Fig. 3). The two parameters that require optimization are the number of dimensions and the number of nearest neighbors. Dimensions refers to the number of previous observations in time to use in the prediction, and the number of nearest neighbors refers to the number of time periods with similar AMOC variability (each consisting of the number of dimensions) to use. I tested models with zero to 25 dimensions and zero to 25 nearest neighbors by calculating each of the models’ RMSE when compared to the observations for the MOC observations from 2004-2014. The model with the lowest RMSE (2.46 Sv) has 10 dimensions (each prediction uses information from the past 400 days), and 14 nearest neighbors. The fact that the model needs just over one year of previous data implies that there may be residual seasonality that the seasonal climatology did not remove.
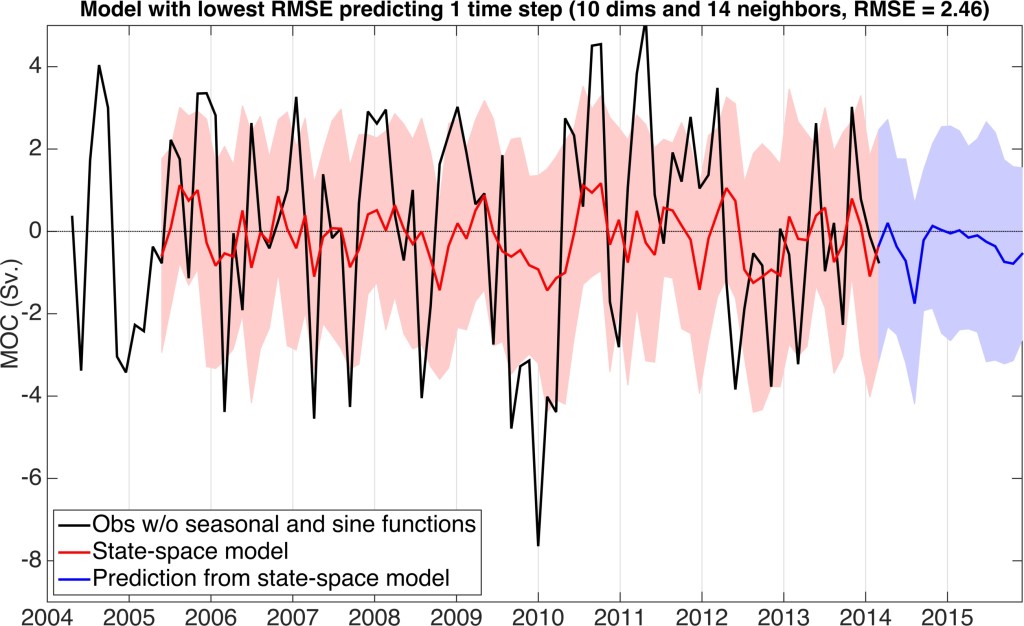
Figure 3. The state-space model fit to RAPID AMOC observations without the climatological seasonal and sinusoid cycles. The model uses 10 dimensions (400 days) and 14 nearest neighbors. State-space models with many nearest neighbors typically under-predict the amount of variance in the original data because the number of values that are averaged to create a prediction is too large.
When the three components (seasonal cycle, long-term oscillation and state-space model) are combined (Fig. 4), they recreate 48.5% of the variability in the observations from 2004-2014 and have a cumulative RMSE of 2.46 Sv. In comparison, models with just the mean MOC (RMSE = 3.42 Sv. and 0% of variance), the climatological seasonal cycle (RMSE = 2.98 Sv. and 23% of variance) and the climatological seasonal cycle plus the long-term sinusoid (RMSE = 2.60 Sv. and 42.1% of variance), do not fit the data as well. The combined model also produces a prediction for the next 18 months of the AMOC (Fig. 4, blue). Of the 6.11 Sv. amplitude in the predicted values, over 75% is due to the seasonal cycle, with the increasing sine component (Fig. 2, blue) slightly compensated by the negative state-space component (Fig. 3, blue). The two peaks in the combined model’s prediction (Fig. 4, blue) of 20.28 Sv. and 20.14 Sv. occur in October 2014 and August 2015, respectively, and the trough of 16.06 Sv. occurs in February 2015.
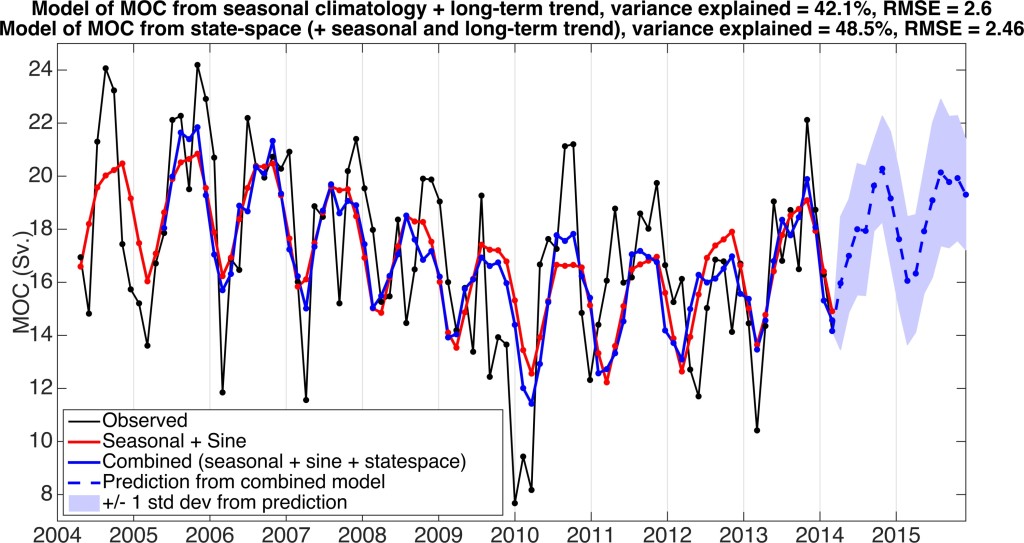
Figure 4. A comparison of statistical models with predictions for the next two years of RAPID AMOC based on the model that combines the seasonal, long-term and state-space models. The average standard deviation for the next two years (blue shading) is +/- 2.4 Sv. The error does not diverge because it depicts the amount of spread in each individual prediction of the next time step provided that the previous prediction was accurate.
References
Kanzow, T. et al. (2007) Observed Flow Compensation Associated with the MOC at 26.5°N in the Atlantic. Science, vol. 307, pp. 938-941.
Smeed, D. et al. (2013) Observed decline of the Atlantic Meridional Overturning Circulation 2004 to 2012. Ocean Science Discussions, vol. 10, pp. 1619-1645.
Posted in News
