The inaugural OSNAP Challenge took place in the Spring of 2017. In the summer of 2016, the OSNAP team collected data from the full array for the first time. Prior to publishing the first estimate of the meridional overturning circulation (MOC), the oceanographic community was invited to predict the overturning variability at the OSNAP line.
Details
For this challenge, the MOC was defined as the maximum of the overturning stream function (Sv) in density space across the whole OSNAP line. Coordinates of the OSNAP mooring array are available here. More information on the OSNAP array and the data products can be found here.
Submissions for the next OSNAP Challenge will open in January of 2019 for MOC estimate – 24 monthly averages of the MOC from September 2016 through August 2018.
How were predictions judged?
Submitted estimates were compared to the 24-month OSNAP MOC time series, which will be released in the fall of 2017. The winning submission minimized the root-mean-square-difference between the estimated and observed MOC.
Follow the OSNAP Challenge
Follow us on the OSNAP blog and on Twitter at @osnap_updates for announcements of upcoming opportunities!
2017 Results
Four groups entered this OSNAP challenge by submitting predictions from September 2014 (initial deployment of the OSNAP line) to August 2016. With no prior OSNAP data available to base predictions, the challenge certainly bore its name!
A preliminary analysis from OSNAP yields a mean MOC of 13.15 Sv with a standard deviation of 3.31 Sv during the 21-month period for September 2014 – May 2016. All predictions are shown in Figure 1. We assessed the accuracy of each prediction by both the root-mean-square-error (RMSE) from the observed time series and its temporal correlation (r) with the observed time series.
Table 1. Skill of the four predictions, ranked according to RMSE.
| Model # | Group | RMSE (Sv) | Correlation (r) |
| 1 | Ben Moat (NOC, UK) | 3.30 | 0.59 |
| 2 | Charlène Feucher (University of Alberta, Canada) | 5.87 | 0.50 |
| 3 | Laura Jackson (Met Office, UK) | 6.34 | -0.14 |
| 4 | Andrea Storto (CMCC, Italy) | 9.86 | 0.33 |
| Mean of predictions | 6.34 |
Winner
Ben Moat and his group from the National Oceanography Centre (NOC) in Southampton, UK won the competition with the lowest RMSE and highest correlation. Congrats to Ben and his colleagues! For their efforts they received the grand prize of OSNAP T-shirts!
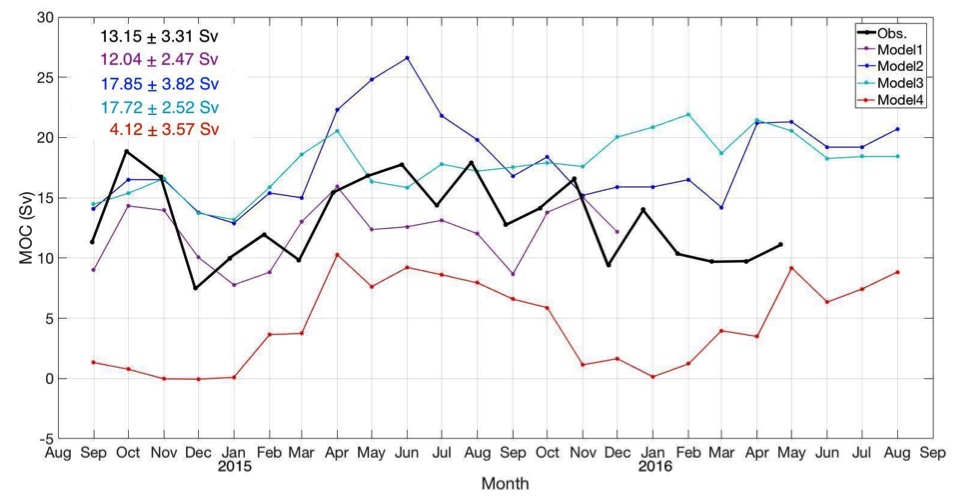
Figure 1. The MOC time series for 2014-2016. The black line shows the observational time series. Colored lines show the four entries (ranked according to RMSE). Numbers in the upper left hand corner indicate the mean MOC plus/minus one standard deviation for each of the submitted time series. Note: Instrument failures near the end of the two-year deployment limited the OSNAP observational estimate to 21 months (September 2014 – May 2016).