At all hours of the day and night, the team of 6 watchstanders have been taking turns hauling a heavy piece of equipment into and out of the ocean. The Knorr stops, and the watchstanders on duty go through an elaborate ritual of deploying a “CTD rosette.” The instrument collects data on the water as it descends and then ascends — sometimes 3 kilometres deep. It is a process that can take hours. When it’s done, the Knorr moves to the next designated spot in the line of CTD stops, and the whole thing starts over again. Three days of that — 21 stops — provides a snapshot of a section of the ocean that looks like this: 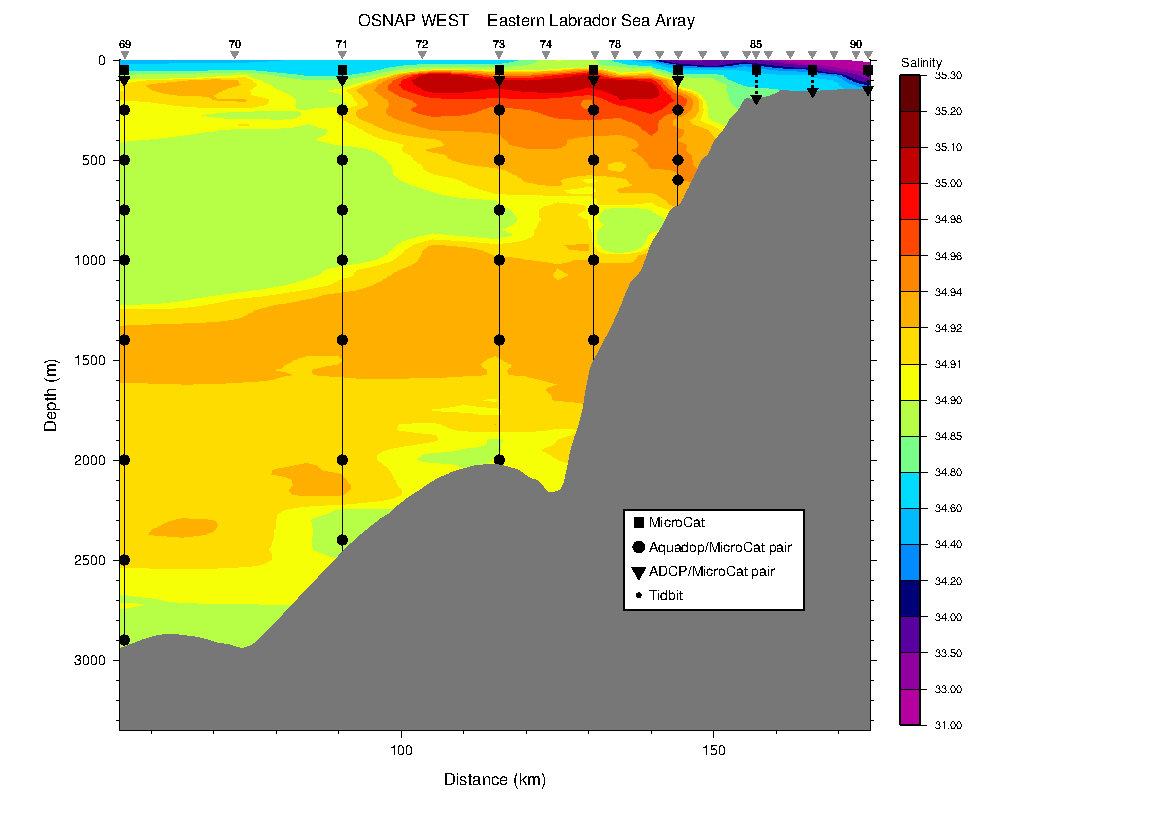
The varying color shows the varying salinity of the water. That purple color depicts fresh, cold, Arctic water, melted from icepacks North of us — with contributions from more local glaciers. The bright red: warm, salty, water, traveling up from the subtropics via the gulf-stream. Lower down, in green and yellow, is a third current. All this water is making its way around the tip of Greenland as “boundary currents” at the moment. It’s headed North West for a bit before they take a turn and go South.
The CTD data is collected in between stops to place buy phentermine online moorings — long strings of instruments, shown in these pictures as lines and dots. These will take a snapshot of the water every two hours, and only take data where instruments (dots) have been placed. In contrast, the CTD rosette collects data every few meters as the rosette makes its descent, collecting information along lots of points — which makes for a spatially high-resolution picture of the water.
To get an idea of what a mooring snapshot will look like, Bob Pickart modified the snapshot provided by the CTD rosette, making a map using only measurements that were taken approximately where the mooring instruments will be. That modified map, with reduced resolution, looks like this:
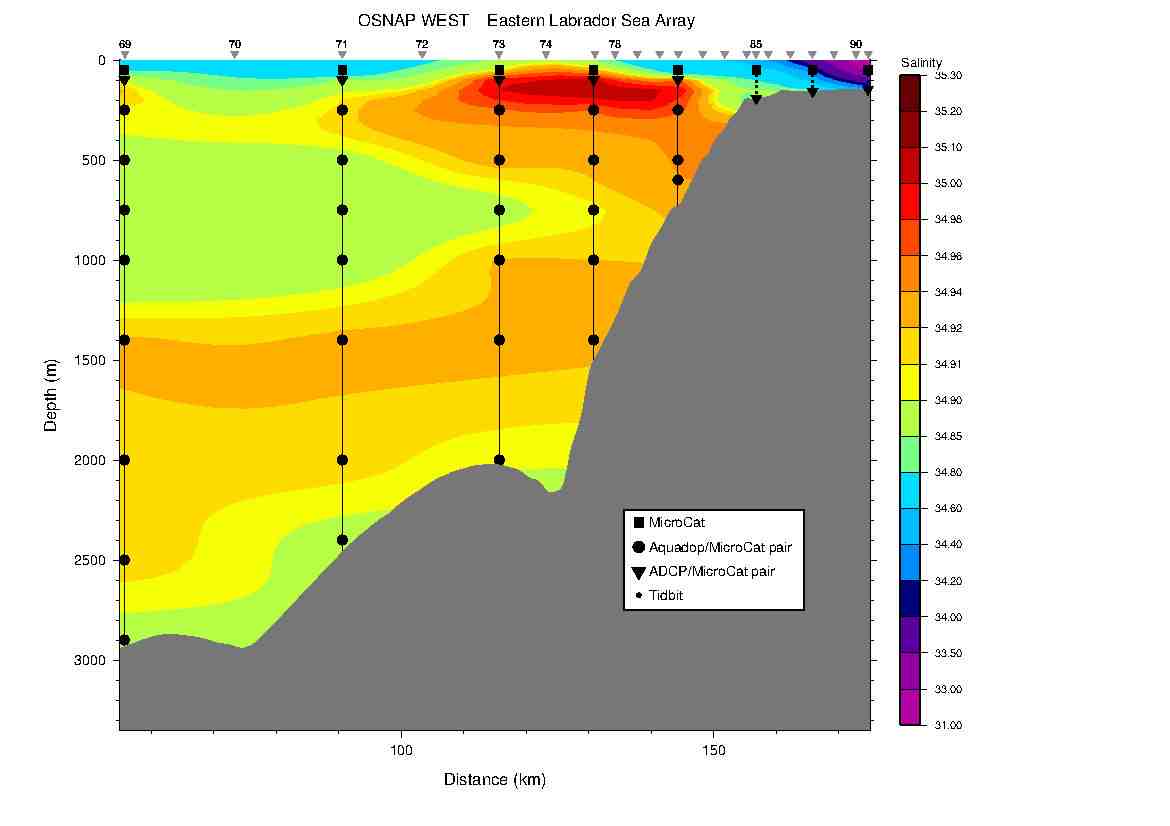
That the picture provided by the “moorings” captures the important contours of the CTD rosette data is encouraging. “You see something like this and you can’t help but get very excited,” says Pickart.
So, why use moorings at all?
While such a moment-in-time assessment is low-res spatially, the moorings will observe how this picture changes in time. A snapshot is taken every two hours. Over two years, that’s about 8,765 of these pictures total. Imagine the above picture changing like a little time-lapse movie. “It’s going to be a quantum leap in the amount of information on this boundary current,” explains Pickart.