By Nick Foukal
As our chief scientist Bob Pickart says, we’re out here on the ocean to build a “picket fence.” Practically though, the pickets in this fence – moorings – are needle-thin on the scale of the ocean. We only have about 40 “needles” (deployed by this leg of OSNAP and others) to span the entire North Atlantic and the flow we’re measuring is about 15 times stronger than all the rivers in the world combined. This is a tall task, so how do we do it?
The key is the ocean’s density, which is a function of the water’s temperature, salinity and pressure (pressure increases as one goes deeper). As luck would have it, many of the instruments we are deploying on this cruise measure those three variables. And from those data we can construct a map of density across the OSNAP line.
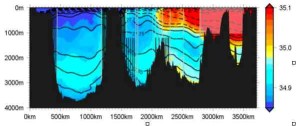
For the most part, the densest water in the ocean is near the bottom. Heavy things sink: that much is fairly intuitive. But there are also areas where the density contours (also called isopycnals) are sloped, and these are locations where the flow tends to be strongest. Dense water wants to flow under less dense water, but due to the rotation of our Earth – we’re looking at a huge distance, almost 10% of the circumference of the planet – instead of that dense water flowing toward the less dense water, it often flows 90° to the right of where it should (in the southern hemisphere the water flows 90° to the left). This is what oceanographers call ‘geostrophic flow’, and most of the ocean obeys the rules of geostrophic flow (areas that don’t always obey geostrophy include coastal regions, the bottom and the very surface). It’s like attempting to push someone overboard and the person ending up on the deck next to you – not exactly intuitive. If that’s hard to understand, you’re not alone: as I enter my fourth year of graduate school in oceanography, I’m still trying to come to grips with this phenomenon… that is the geostrophy one, not the man overboard experiment – I’m pretty sure I know how that one would end up.
So we place moorings where we think the slopes of the density contours change across the OSNAP line. Much of this change happens near coastlines. Given that those locations are exactly what we’re trying to discover, it’s hard to know where to put the moorings ahead of time. Luckily Bob Pickart and the other PIs on the project have studied this part of the ocean previously. Their expertise, combined with ocean circulation models, instruct us on the best locations.
The principle of geostrophic flow instructs us to measure density – an example of theory guiding observations. Knowing what to look for can make even the tallest tasks attainable.
A vertical slice of the average salinity (colors) and density (contours) across the OSNAP array. Mooring locations (vertical lines) and glider domain (shaded box) are indicated. Depth is on the vertical axis, distance across OSNAP line is on the horizontal axis. Note the vertical exaggeration (depth in meters, distance in kilometers). To reconstruct the velocity field, we directly measure the currents at the boundaries and the flanks of the Reykjanes Ridge and then use T/S sensors and gliders to estimate the interior geostrophic velocities. Black moorings indicate where the velocity is directly measured and gray moorings double as direct velocity measures and endpoints of the geostrophic regions.
Nick Foukal is an oceanography graduate student at Duke University. He studies how temperature anomalies – warm and cold events in the ocean – move from the Gulf Stream toward northern Europe. He is part of the CTD team – a group of four students and two other ocean enthusiasts – who operate an instrument that goes to the bottom of the ocean to collect data on the depth, temperature and salinity of the water.

