by Leah McRaven
Physical Oceanography
Woods Hole Oceanographic Institution
When you decide to study the currents that whip past the continent of Greenland and that transform the waters in the Irminger and Labrador Seas, an oceanographer must be willing to make peace with an ocean that isn’t entirely liquid. The extreme elements that shape the rocks along the Greenland coast also actively chisel away at the hundreds of glacial termini that meet the ocean edge. This chiseling leads to a constant flux of icebergs, small icebergs called bergy bits, and even smaller ice chunks called growlers. With ice in its various sizes and jagged shapes breaking away from the entire continent, the currents in the OSNAP region transport and mix more than just water.
Logistically, the OSNAP study region is one of the hardest places in the world ocean to successfully execute fieldwork. To start, the East Greenland Coastal Current, the East Greenland Current, and the Irminger Current can flow at speeds well over 1 knot as they round the tip of Greenland. In addition to strong currents, the area is home to a record: the windiest place in the world ocean. Simple ship maneuvering tasks, such as holding station while collecting data or recovering moorings (Figure 1), become challenging for the mates on the bridge as unforgiving winds build up rough seas that are already swiftly flowing. Floating ice is quite literally the icing on the OSNAP cake.
Ice adds a whole new dimension, and phase of matter, to navigation and operations at sea. From a distance, it can be nearly impossible to decipher ice chunks from whitecaps and sea spray. Large icebergs can be easy to see if they express above the surface of the ocean, but the majority of an iceberg’s mass lies below the sea surface and is difficult to see. Ice can also block access to nearby fjords used for shelter in severe weather. These navigation dangers keep the R/V Armstrong mates on high alert at all times as they steer through storms, darkness, and thick fog.
In order to help navigation efforts, WHOI researchers employed the help of the Danish Meteorological Institute (DMI), which specializes in satellite sea ice imagery. DMI is able to provide the ship with updates on the location of ice based on satellites that take Infrared (to see through clouds) and visible images of the Earth’s surface. Not only is this information extremely helpful, the maps can be stunning. Ice information from our current OSNAP cruise (on September 9th) is shown in Figure 2. This satellite image from the southern tip of Greenland is an example of how satellite-detectible ice features disperse from their mother fjords into the surrounding ocean.
Ice can also run into the OSNAP moorings, pushing instruments out of the way, or even snapping them off their lines making it impossible to recover them and their precious data. Our six shallow moorings on the continental shelf were, in fact, designed with drifting ice in mind. Equipped with a tripod-like structure at their base, these moorings have most of their instrumentation mounted near the sea floor. In an attempt to capture shallow data, the moorings also have special tethers extending up from the tripod base with weak links to top flotation. These weak links are designed to break easily should an iceberg snag the line, with the break point located strategically below the flotation and above an instrument. In the event of tether breakage, the instrument sinks to the bottom, but remains attached to the rest of the mooring so that it can still be recovered. Figure 3 shows a depiction of this breaking process. Of the recovered moorings from this year’s cruise, three of the six shallow moorings had their top floats ripped off within less than a year!
With all of the challenges handed to us from ocean elements, our crew has excelled in accepting the challenges brought on by ice. Of all 16 moorings that we aimed to recover on this cruise, all have successfully come back. In the face of extreme weather and rough seas, we have completed over 240 profile measurements of ocean temperature, salinity, and velocity thus far. And through all of these challenges, no one can deny how much they still enjoy seeing the Greenland coast in full panache with its towering and craggy icebergs.
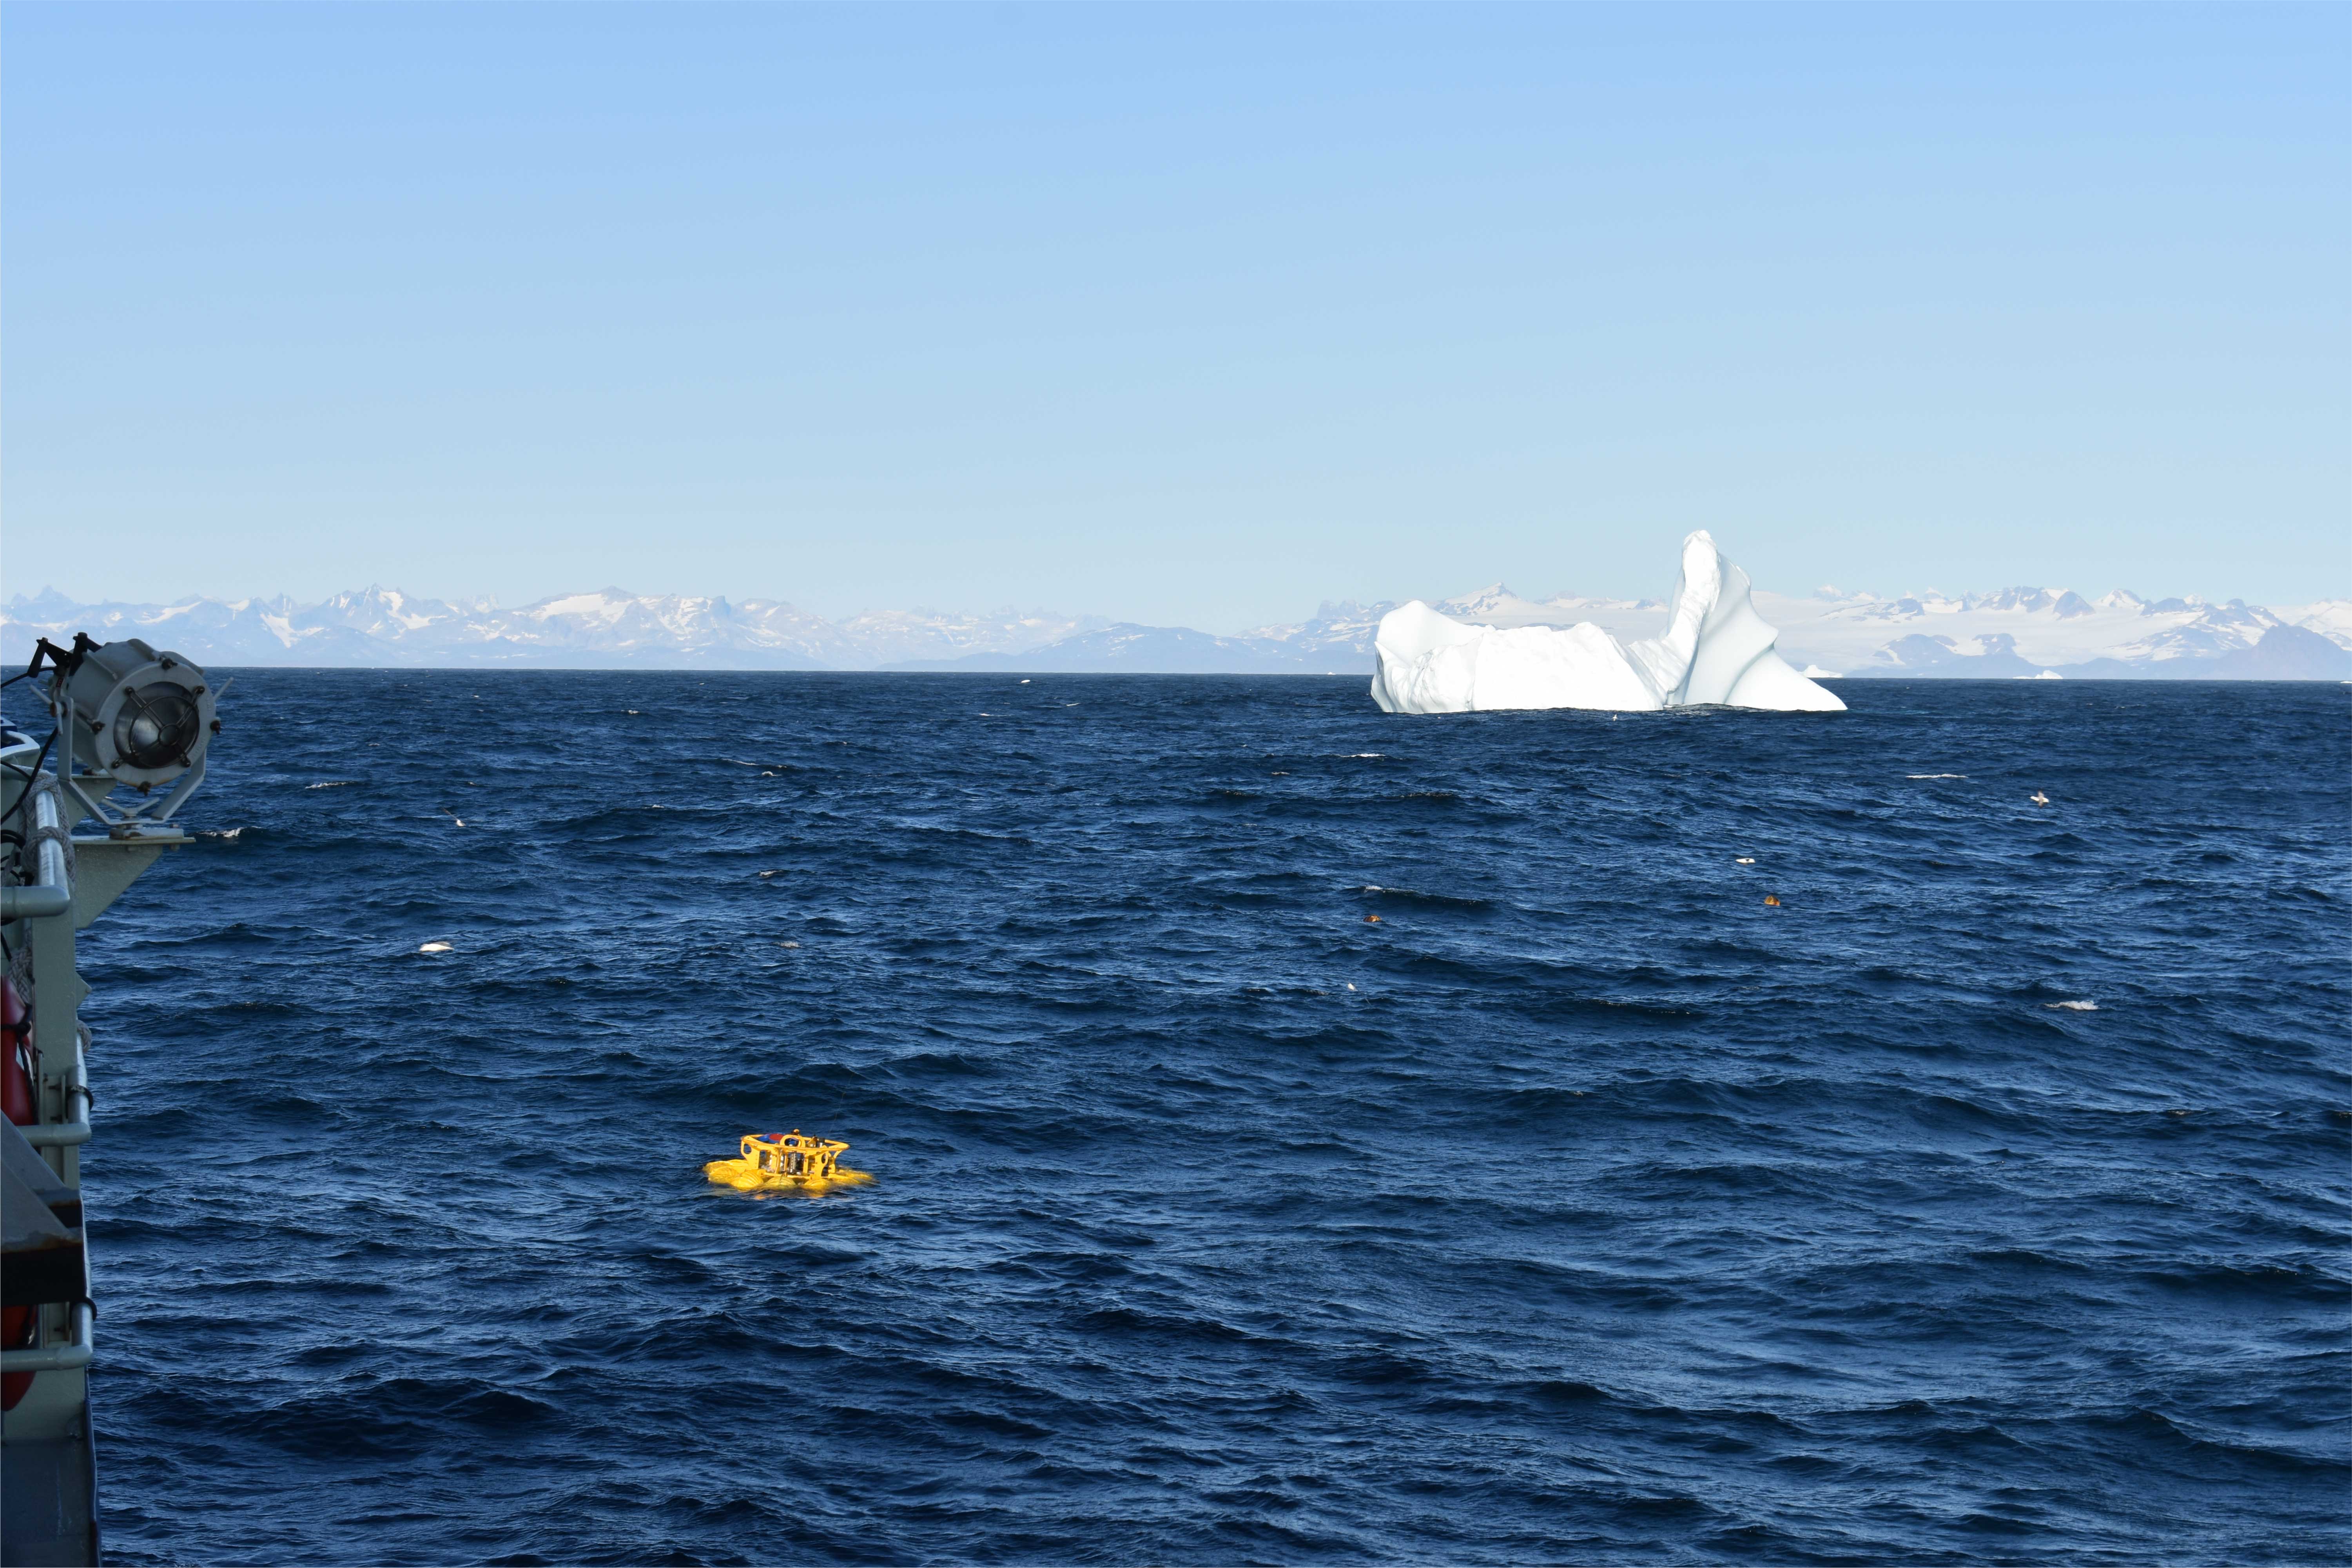
Figure 1. An iceberg off the stern of R/V Armstrong during a tripod mooring recovery during the current OSNAP cruise.
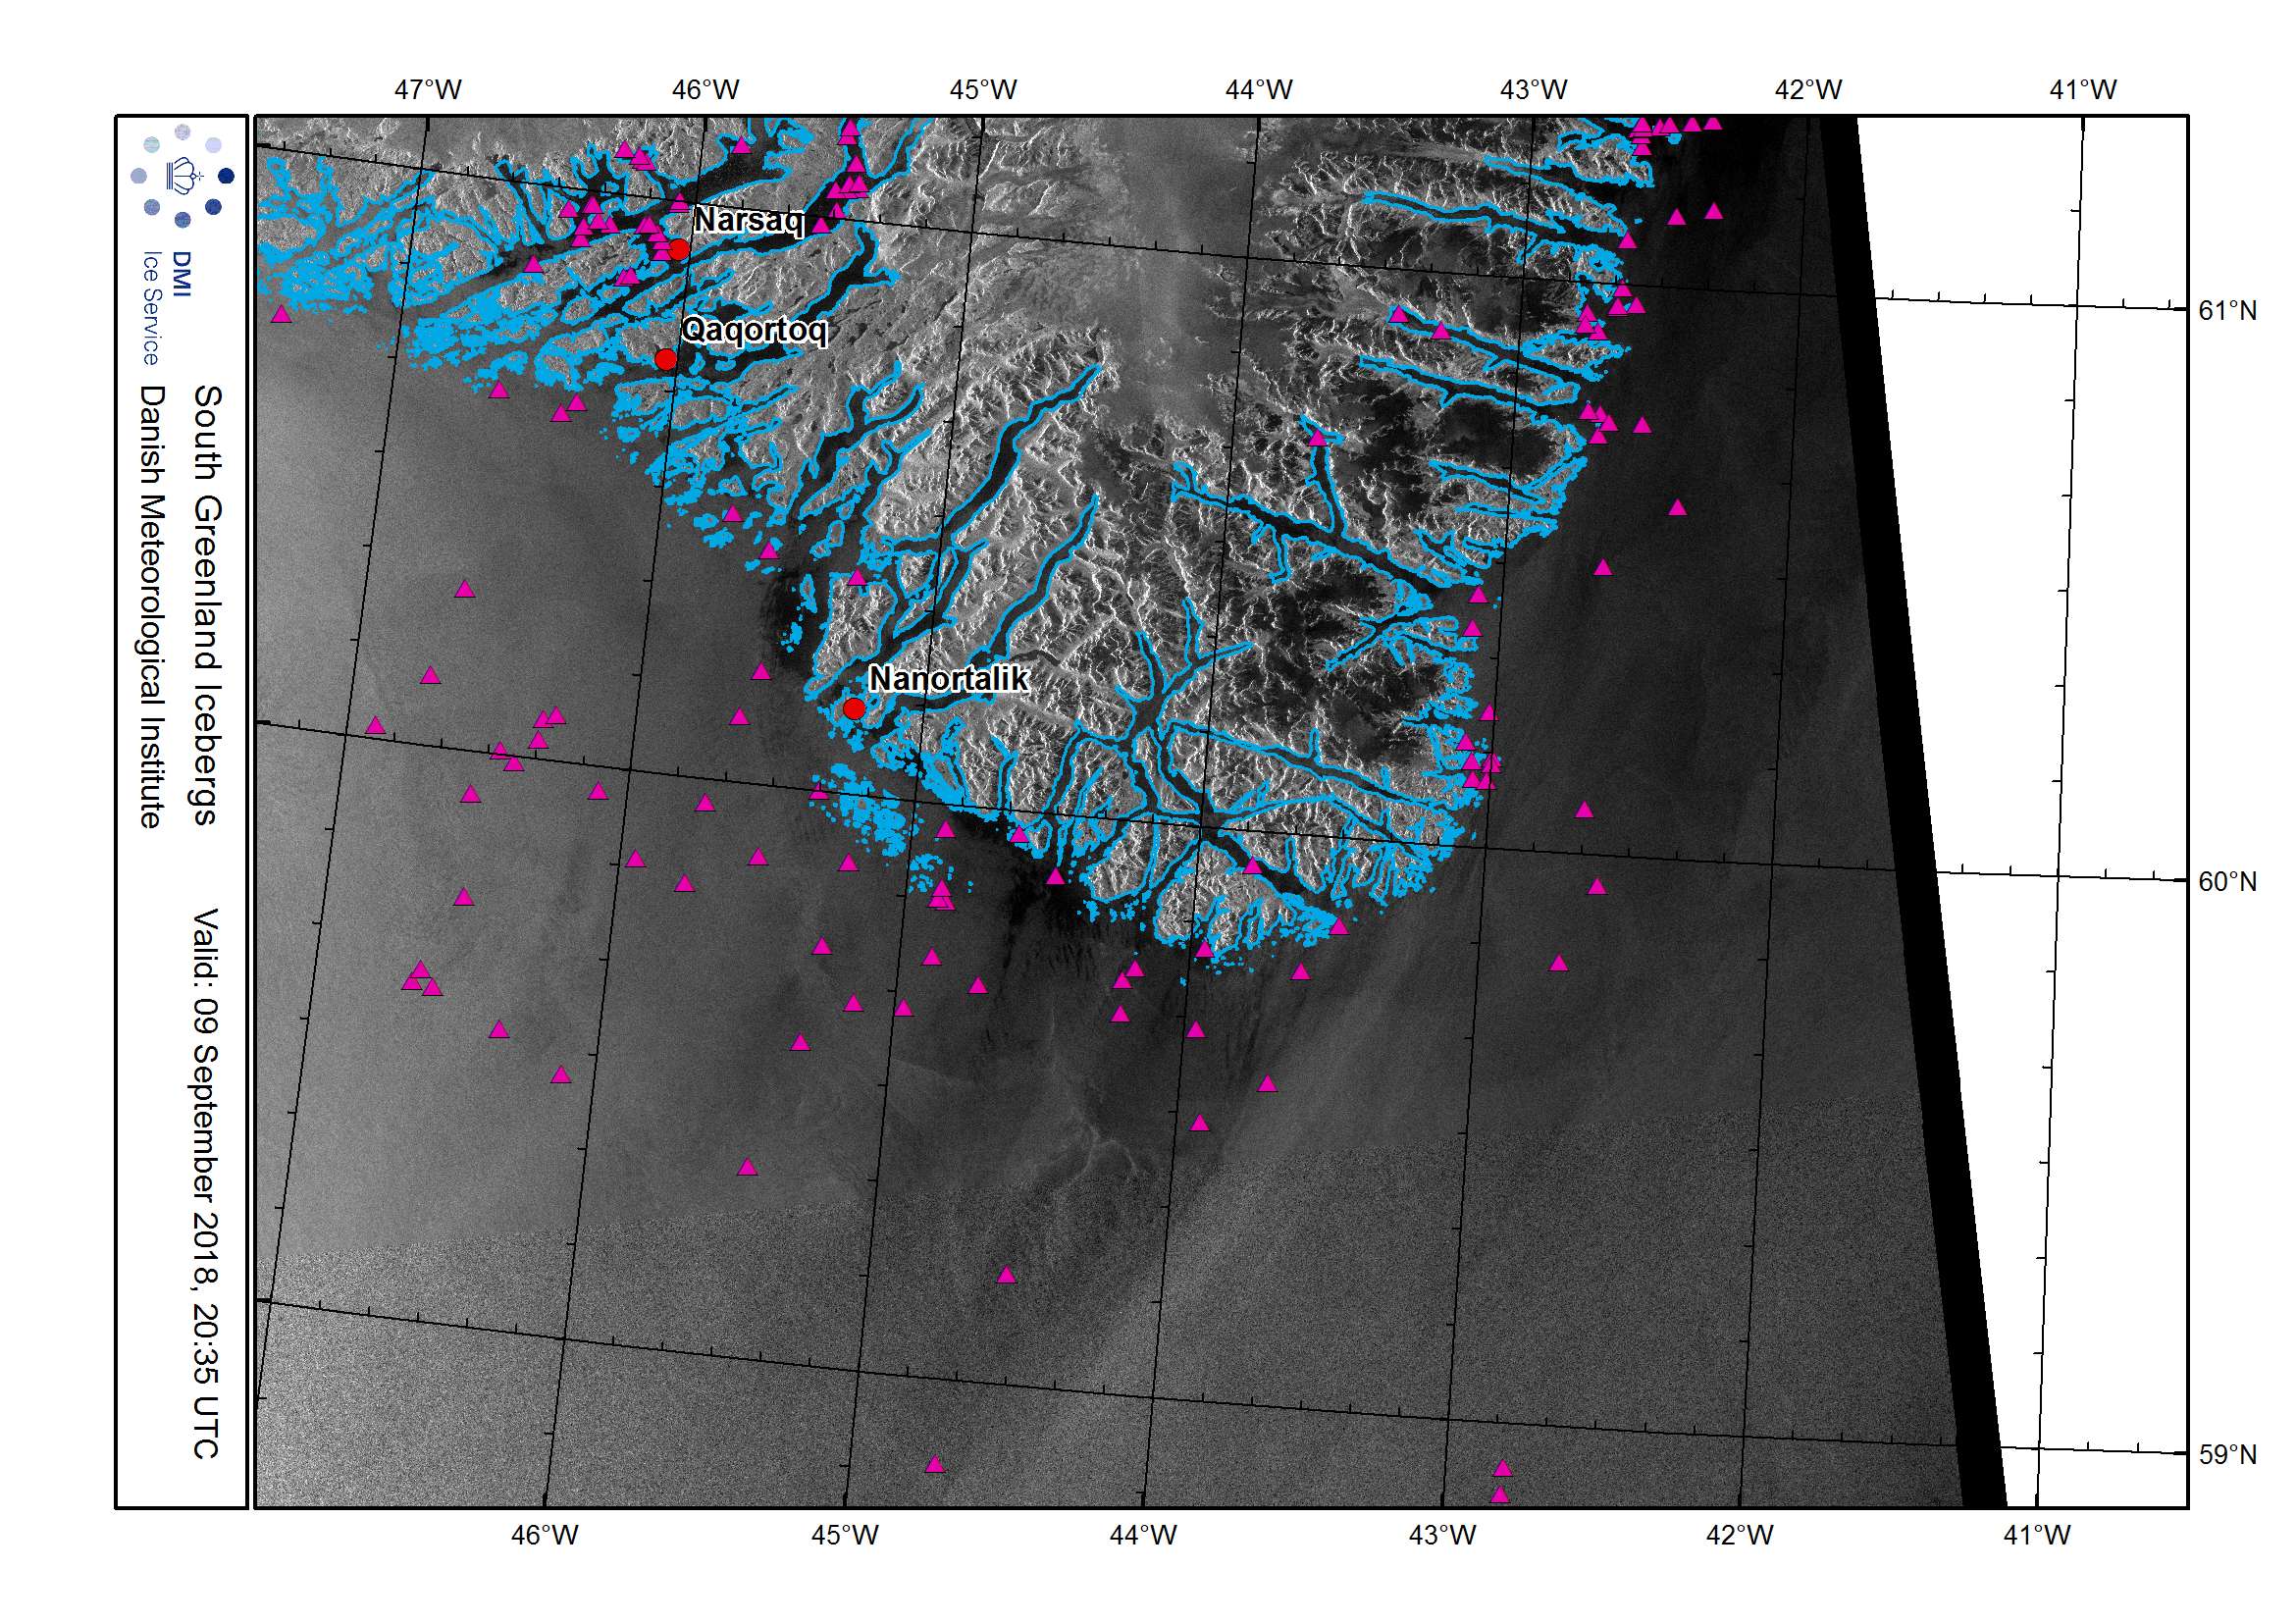
Figure 2. Denoted infrared satellite imagery courtesy of the Danish Meteorological Institute. Pink triangle indicate the position of satellite-identified icebergs throughout the southern Greenland region.
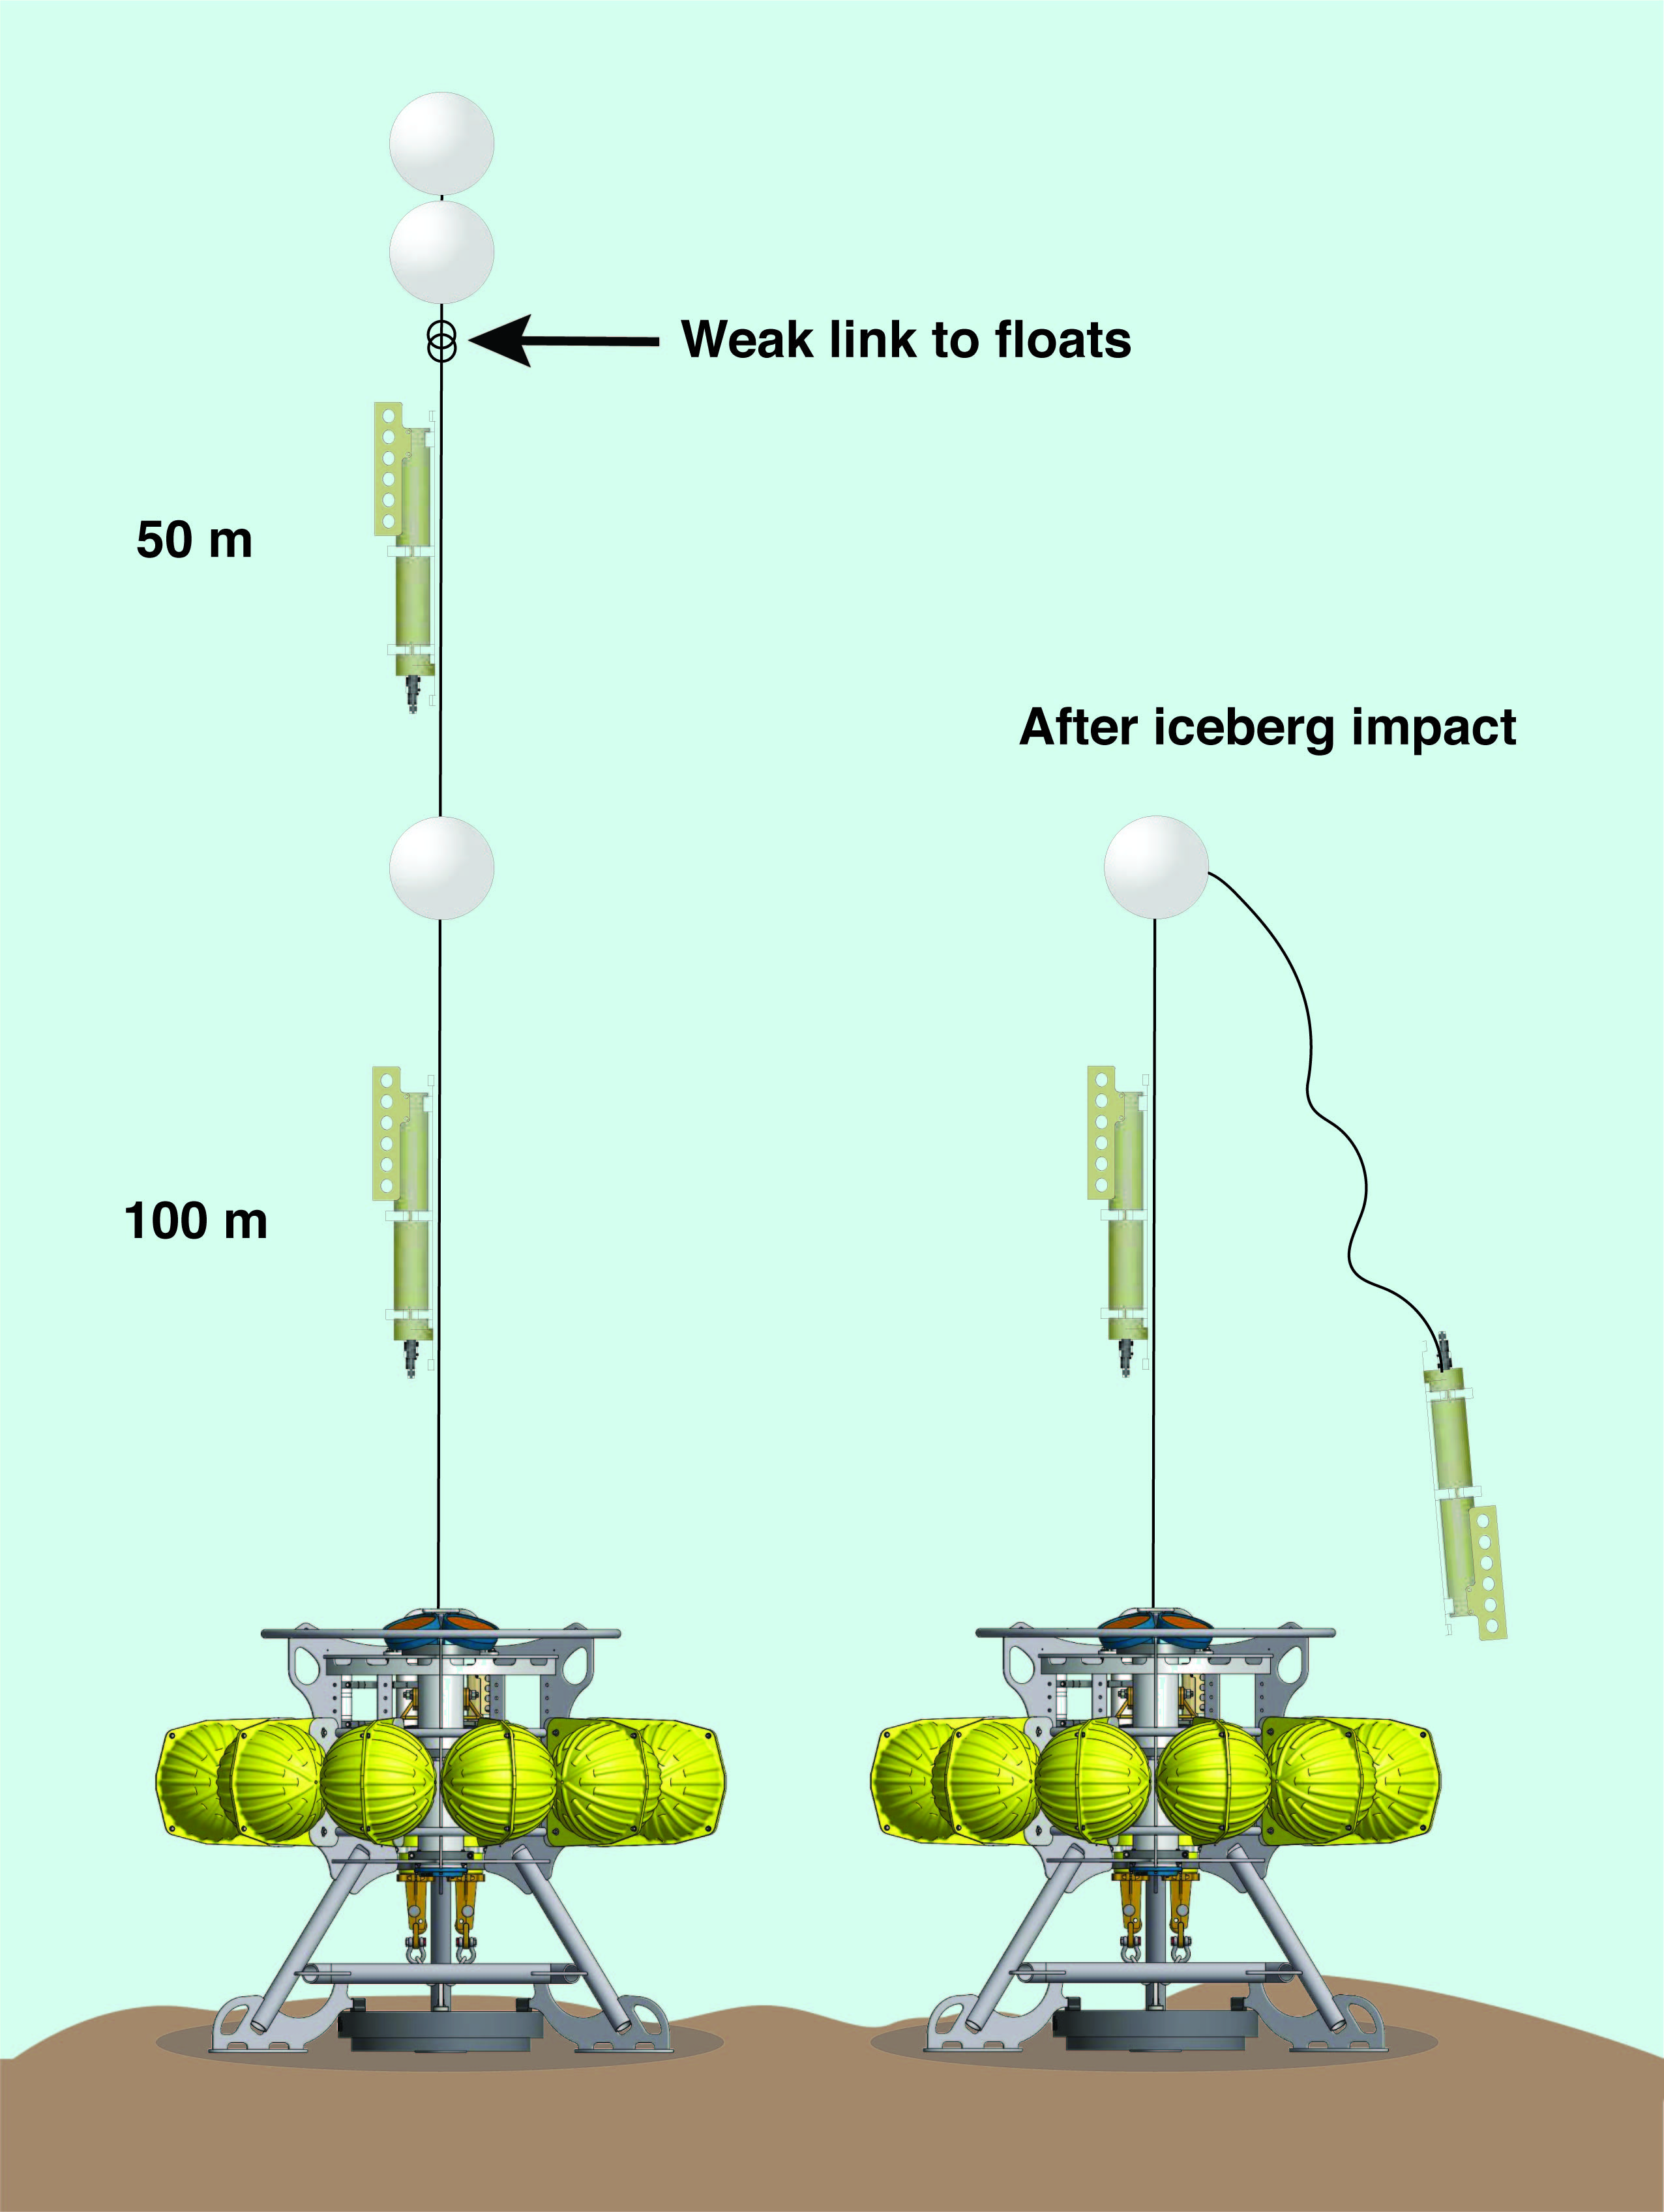
Figure 3. Illustration of the OSNAP tripod moorings with weak links to top flotation. The left mooring demonstrates a normal deployment, while the right mooring shows a deployment with interference from an iceberg. In the event of an iceberg snagging the upper mooring tether, the top floats are released and the shallowest instrument falls, while still remaining connected to the mooring.