by Amy Bower and Heather Furey
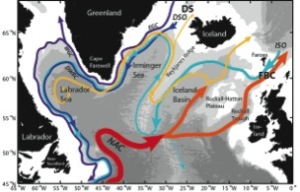
Over the past several decades, oceanographers have constructed maps of the deep currents in the North Atlantic by piecing together measurements of currents and water properties from widely separated locations at different times. An example is shown in Figure 1. Such diagrams are beautiful in their simplicity and valuable for communicating the importance of northward-flowing warm and southward-flowing cold currents that together transport vast amounts of heat from the equatorial to polar regions.

Figure 1: Schematic diagram of the major currents thought to be responsible for northward heat transport in the subpolar North Atlantic.
While useful as a summary of buy lasix canada subpolar North Atlantic overturning circulation, we need to remind ourselves that such ‘plumbing’ diagrams, if taken too literally, can give the false impression that there is very little connection between the boundaries of the ocean basin and the interior. Acoustically tracked underwater drifting buoys (called RAFOS floats) are being deployed in the deep boundary currents of the subpolar North Atlantic as part of OSNAP to investigate this connection (see previous posts for more details about the RAFOS float program in OSNAP at http://www.o-snap.org/water-goes-here-water-goes-there/ and http://www.o-snap.org/glass-floats-embark-on-a-2-year-mission-at-sea/). This Lagrangian approach to measuring ocean currents, whereby freely drifting floats reveal deep current pathways by drifting with the water (in contrast to the Eulerian approach, whereby sensors fixed in one position measure current speed and direction over a period of time) is ideal for mapping out current pathways over a large area, and with repeated deployments, we can determine how those pathways are changing in time.
Figure 1 may also give the false impression that we know where all the major currents are, when in fact,

Figure 2. Styrofoam cup lowered into the Bight Fracture Zone 56° 56.4’N 33° 31.2’W, on 21 July 2014.
especially in the deepest reaches of the ocean basins, there are some important questions that remain to be answered regarding the current pathways. We are particularly interested in the routes of Iceland-Scotland Overflow (or ISO) water, which enters the North Atlantic as a plume of cold, saline, dense water between Scotland and the Faroes (Figure 1). The ISO transport is one of the two main components of the deep limb of the Atlantic Meridional Overturning Circulation (AMOC), the other being the transport of Denmark Strait Overflow (DSO) water, another source of dense water that enters the North Atlantic between Greenland and Iceland (Figure 1). Based on scant few studies, the conventional wisdom is that ISO water flows in a smooth deep boundary current around the perimeter of the subpolar basins, as illustrated in Figure 1. The diagram shows ISO water flowing first far to the southwest along the Reykjanes Ridge to about 53N, where it finally finds a gap in the ridge that is deep enough for it to pass through to the western North Atlantic. This view is based largely on one study of ISOW flow through this gap (called the Charlie-Gibbs Fracture Zone) in the late 1980’s. Bits of more recent evidence from float, current meter buy priligy online mooring, numerical model, and water property studies suggest that perhaps only a little more than half of the ISO water flows through the Charlie-Gibbs Fracture Zone, and that another gap in the ridge located farther north, called the Bight Fracture Zone (near 57N), may be another important gateway for ISO to reach the western basins.

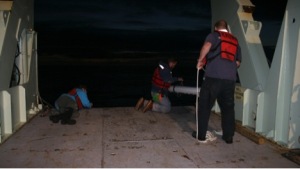
Figure 3. Very early morning (0200UTC) deployment of a RAFOS float over the eastern flank of the Reykjanes Ridge, July 2014 R/V Knorr. Float work is like CTD work, it happens anytime day or night. Here, the glass float is in the PVC deployment tube, which shelters the glass surface of the float from the rough deck. Although the glass survives well under extreme pressures of the deep ocean, scratches in the glass result in weak spots which can cause implosion. The first ten eastern flank Reykjanes Ridge floats are in the water, we have twenty more to go. (With Robb Hagg, Paul St. Onge, and Heather Furey.)
In fact, with the last gasp of remaining shiptime on OSNAP Leg 2 last summer on the R/V Knorr, we went to the Bight and collected a set of hydrographic and velocity data that do indicate ISO water is travelling from the Iceland Basin to the Irminger Basin through this northern latitude fracture zone. We even have the Styrofoam cup to prove we were there (Figure 2).
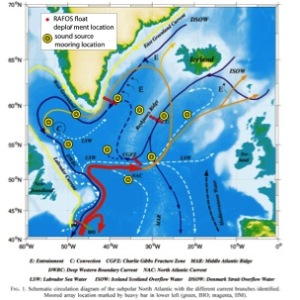
The RAFOS floats launched during OSNAP will go a long way toward unraveling this mystery of the ISO water pathways. About 30 floats will be released directly in the ISO water (at 1800-2400 meters) in the Iceland Basin north of both gaps (near 59N, one deployment shown in Figure 3) over a three-year period (Figures 4 and 5). Each float will drift at depth for two years before re-surfacing and transmitting its data, with which we will reconstruct its underwater trajectory. Together the trajectories will give us a first look at the relative importance of the two gaps in directing ISO water to the western subpolar region.

Figure 4: Positions of 2014 RAFOS float releases and the sound sources used for tracking them, superimposed on schematic circulation diagram from Schott et al. (1999).
The discoveries won’t stop there, as the floats will also reveal whether ISO water follows a continuous path around the Irminger and Labrador Basins, or ‘squirts’ into the interior of these two basins after passing through the gaps. We will have to wait a few years for the answer, but the prospect of a new discovery is one of the most exciting aspects of this research for us.

Figure 5: Cross-section of salinity showing release sites of deep RAFOS floats over the eastern flank of the Reykjanes Ridge in July 2014. The target ISO water, which is slightly more saline than the surrounding water masses, is located in a thin layer very close to the sea floor. The floats were ballasted to drift 100-200 meters above the bottom. Figure by Maurits Kooreman (University of Utrecht).