By Elizabeth Comer
In my last blog a year ago I mentioned I would be going to sea for the Extended Ellett Line (fig. 1) annual research cruise, which is part of the OSNAP array. I boarded the RRS Discovery during June and we steamed towards Iceland, where we started sampling at each CDT station whilst heading back to Scotland. During this cruise I focussed mainly on the ADCP measurements and processing, as I was going to start using it within my research and this was the perfect way to get familiar with it. I had a brilliant time on this cruise, as the photos hopefully depict (fig. 2, 3 and 4), and it was a great insight to Oceanography in the field.
Now onto how this data will aid my research. The aim of my current research is to investigate the long-term mean and variability in volume, freshwater and heat transport of the Subpolar North Atlantic. All the hydrographic and velocity measurements collected annually are used to compute these transports, providing a near 20-year timeseries. It is important that we take continuous measurements at this location and compute these transports as 90% of the Atlantic inflow into the Nordica Sea and Arctic takes place between Iceland and Scotland, as well as roughly half the returning buy levitra online dense water. This research will add to our knowledge of how the Meridional Overturning Circulation in the Subpolar Atlantic is varying on a decadal to seasonal timescale, and add insight to the mechanisms controlling it. This observational data also enables the enhancement of oceanic models to produce transport variabilities on longer timescales.
The research into the long-term transport that has been carried out with my Supervisors Dr Penny Holliday and Prof Sheldon Bacon will be published in the near future, but below is a taster of the 18-year (1997-2015) mean Lowered-ADCP velocity across the section (fig. 5). This data is used to produce the long-term absolute velocity by providing a reference velocity for the geostrophic velocity field, which the transports are computed from. In this study I investigate how the transport varies across the region, highlighting the key routes for transport and why it is important we know this. Furthermore, the Scottish Continental Slope Current that runs northward along the Scottish shelf edge and the Rockall-Hatton Bank have the highest temperatures and salinities of the region. Hence, I hypothesis that these are fundamental routes for heat transport northward.
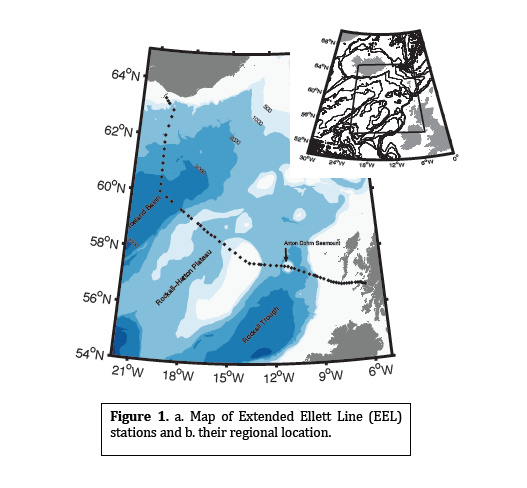
Figure 1
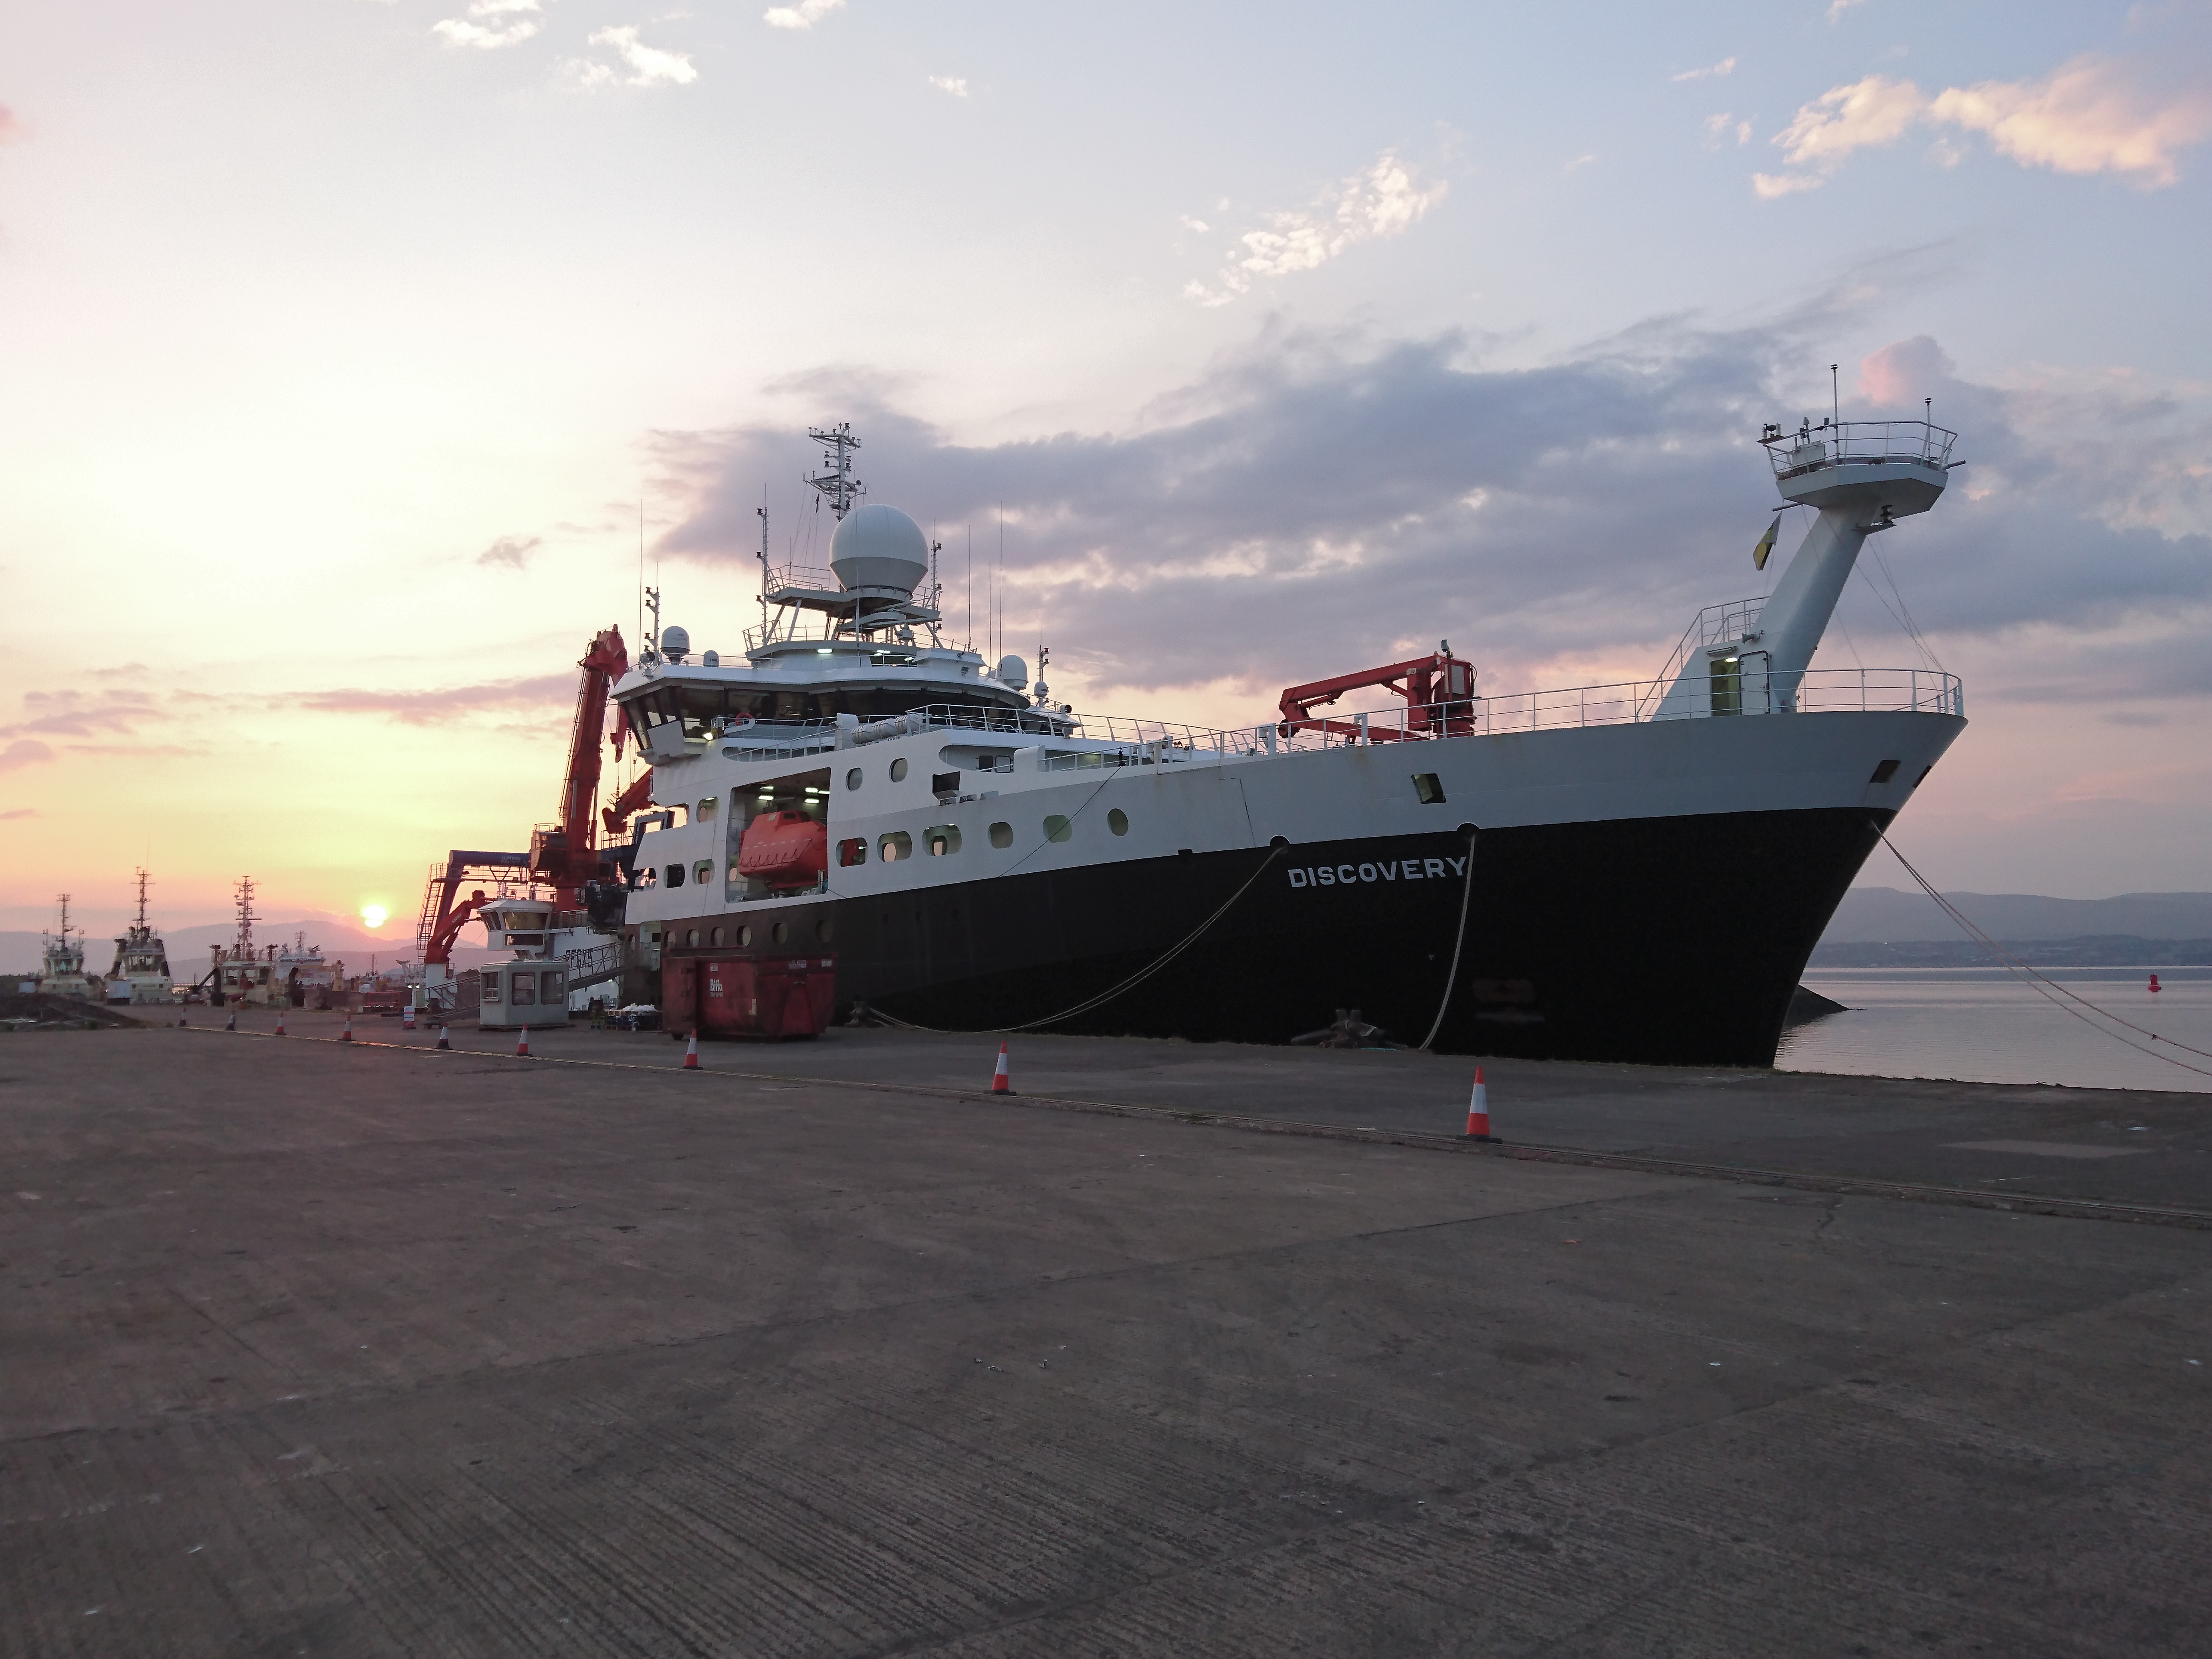
Figure 2
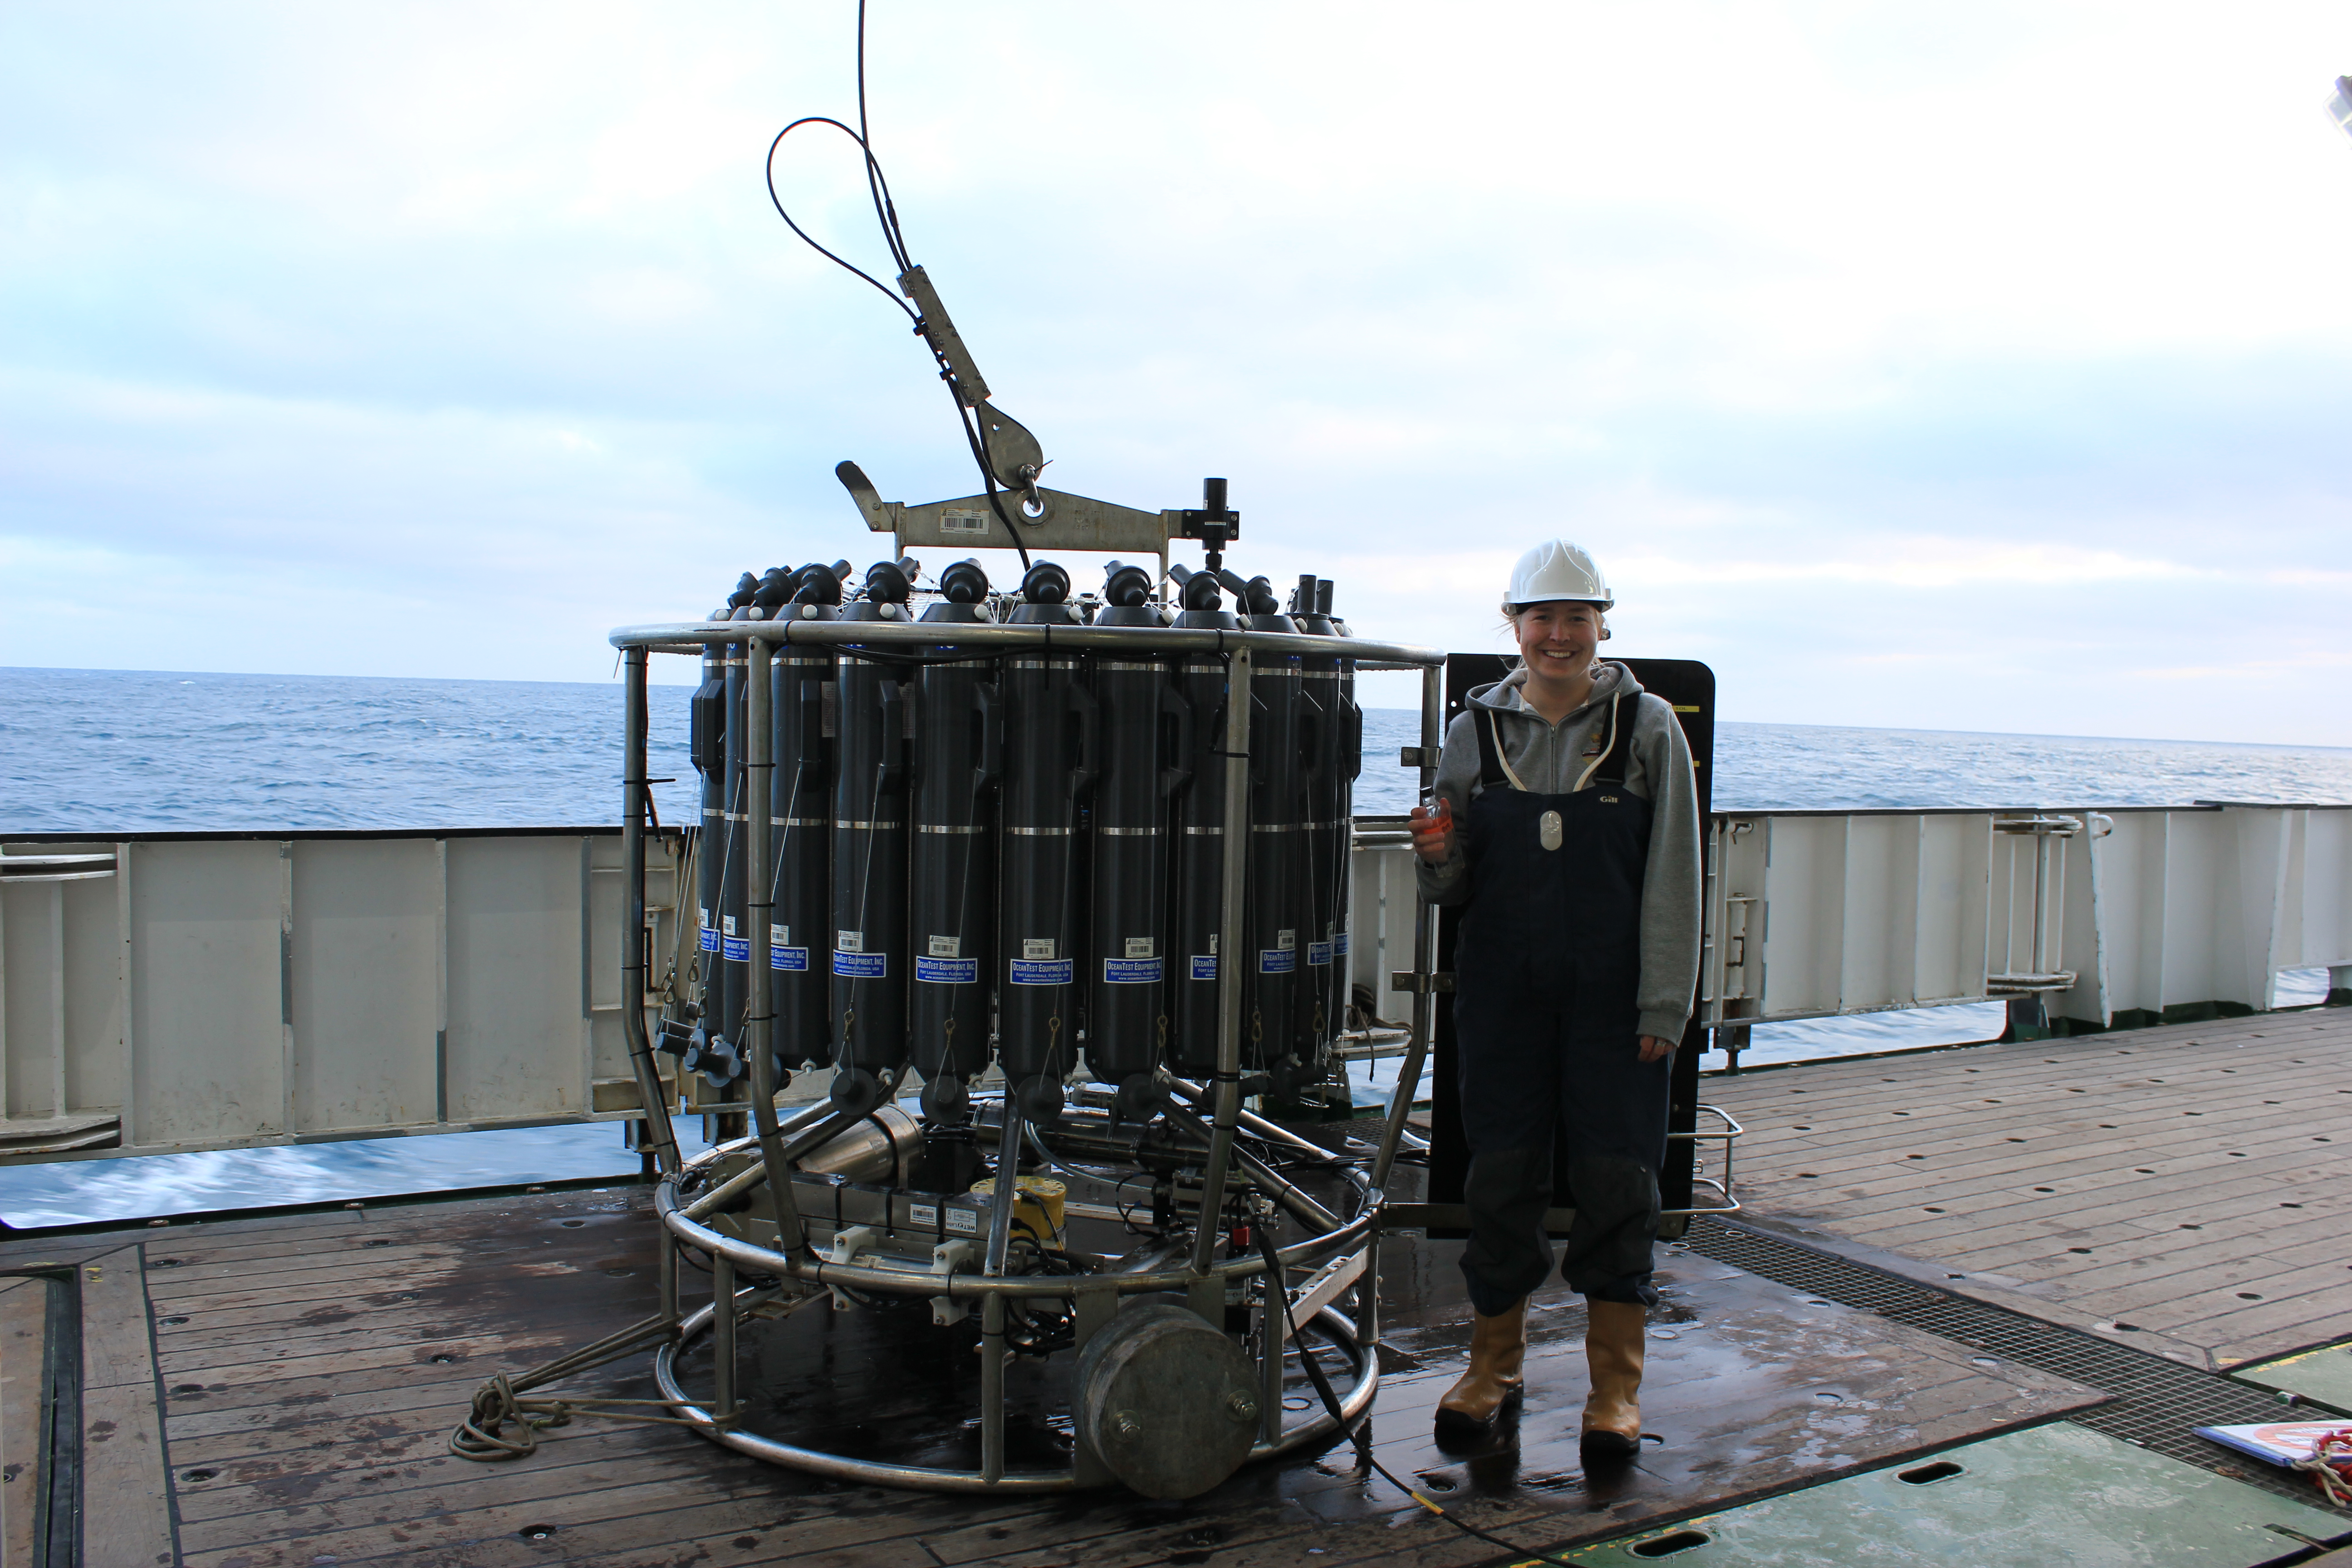
Figure 3
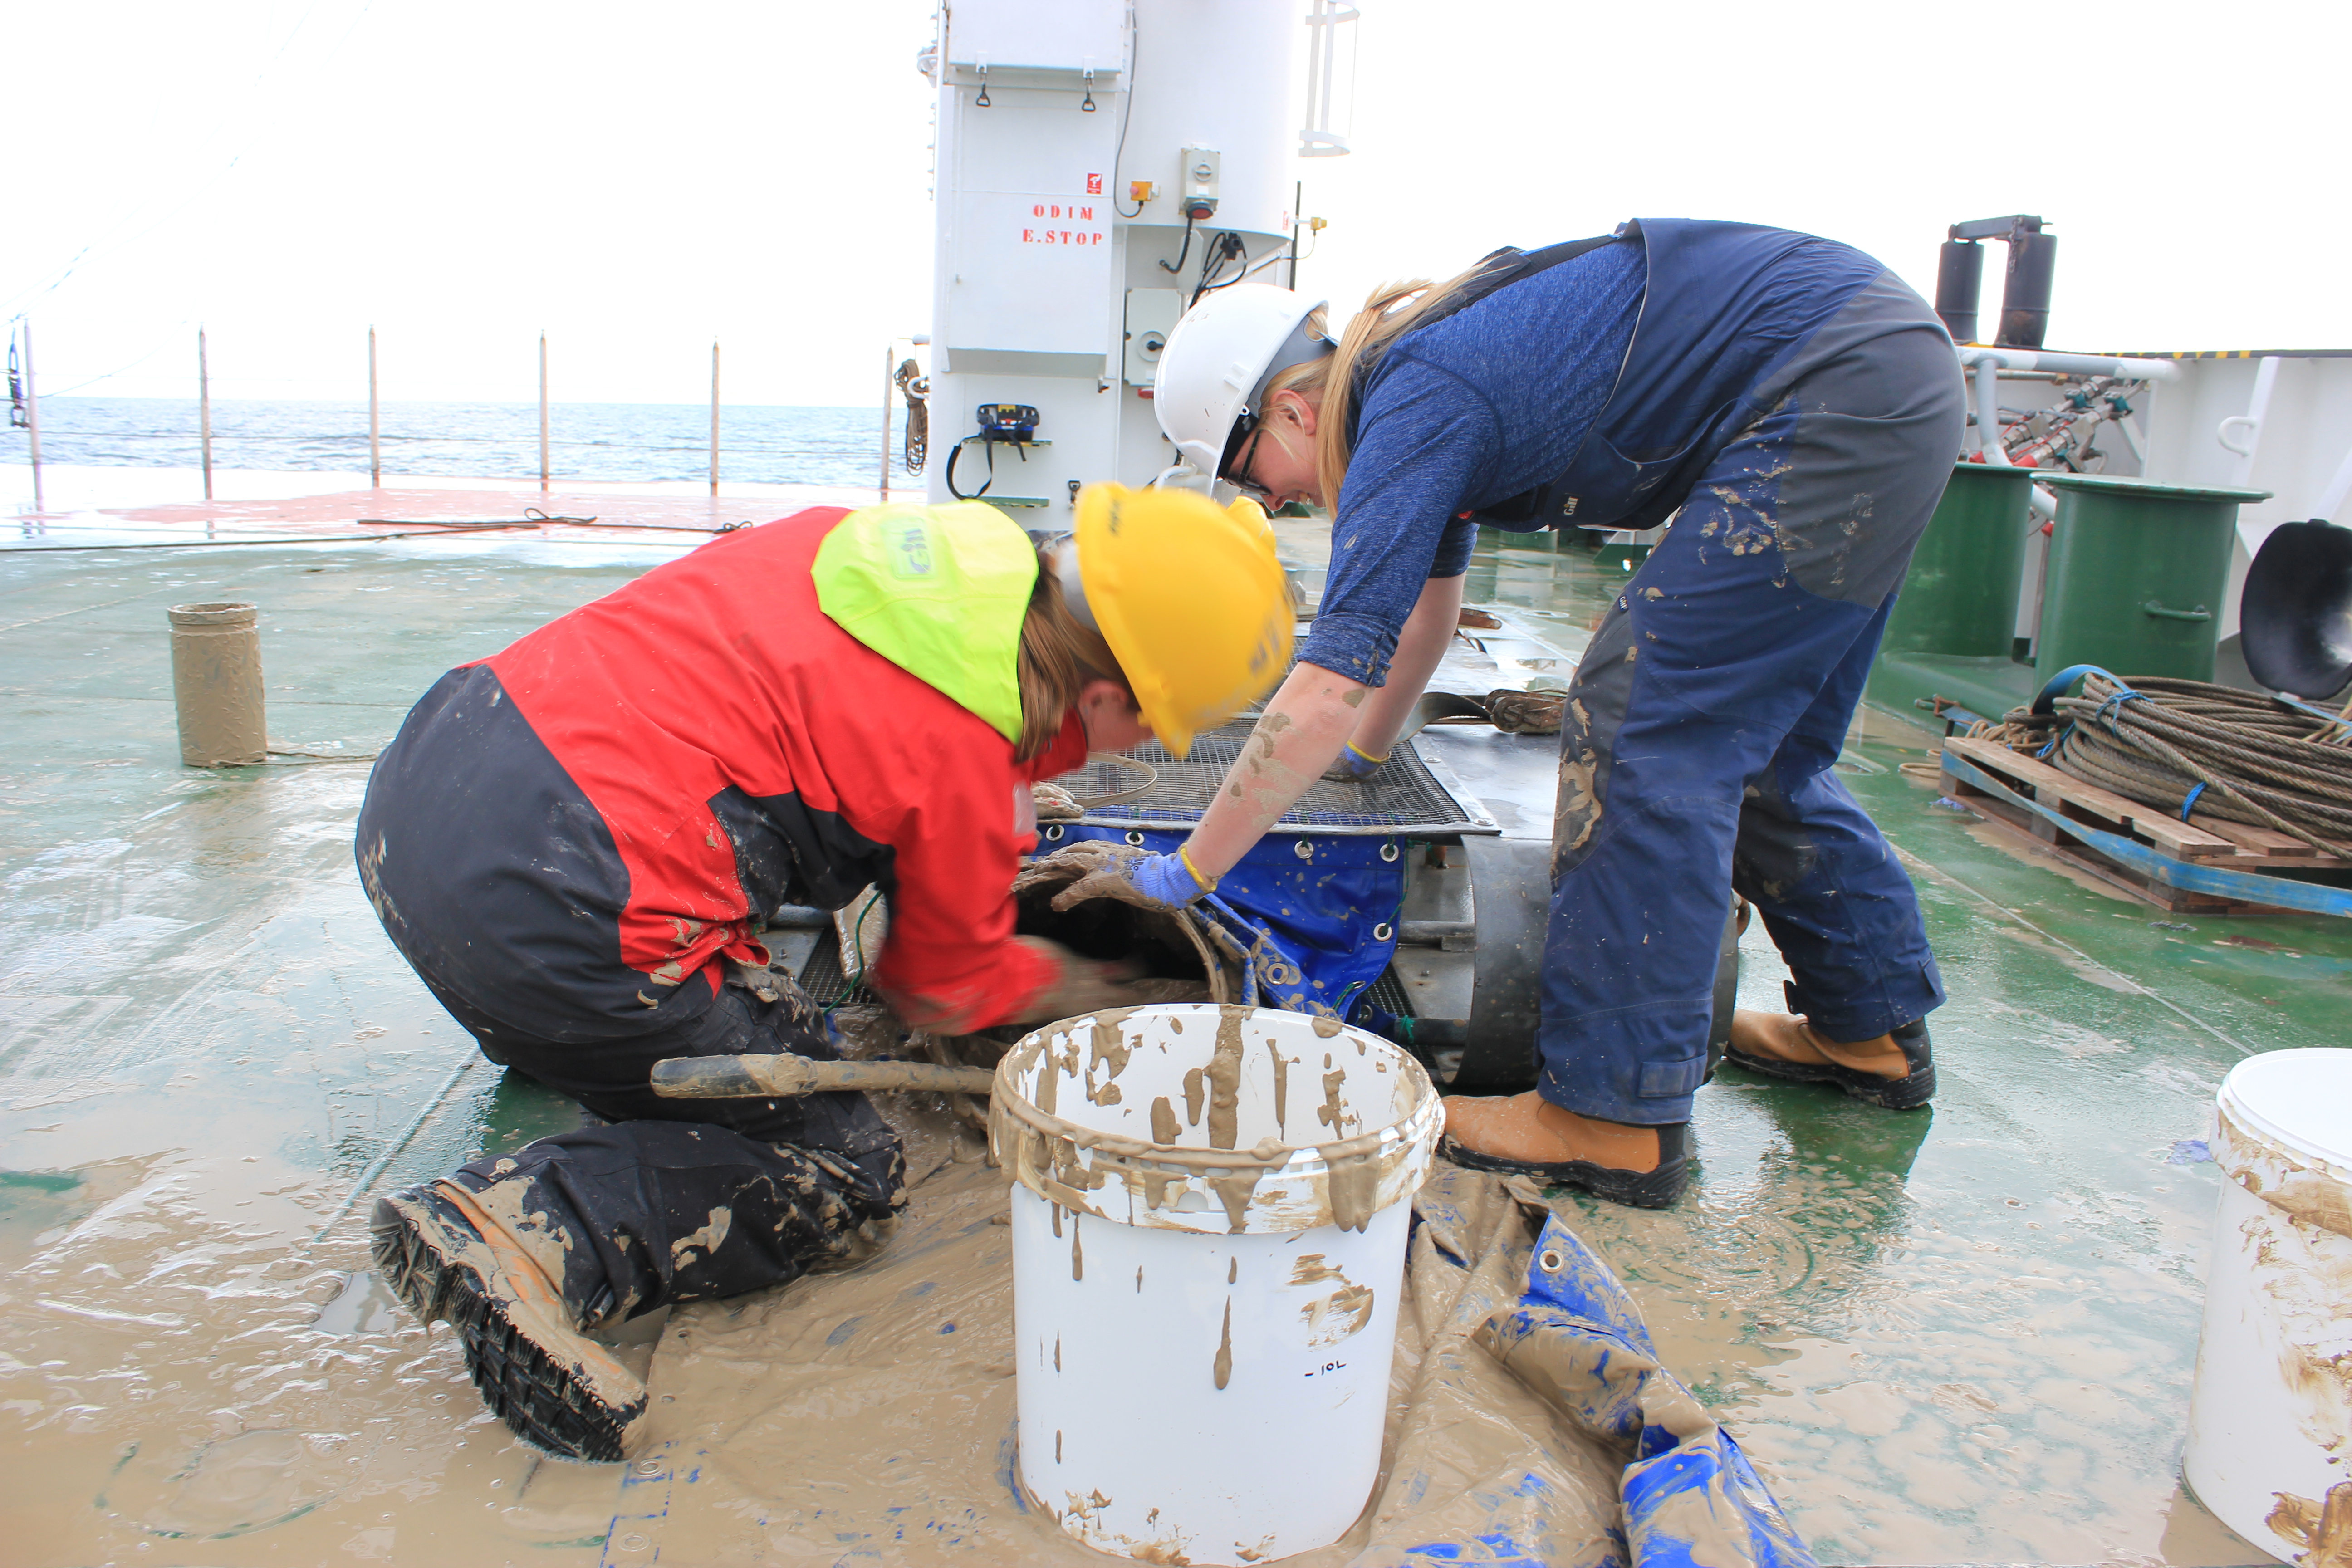
Figure 4
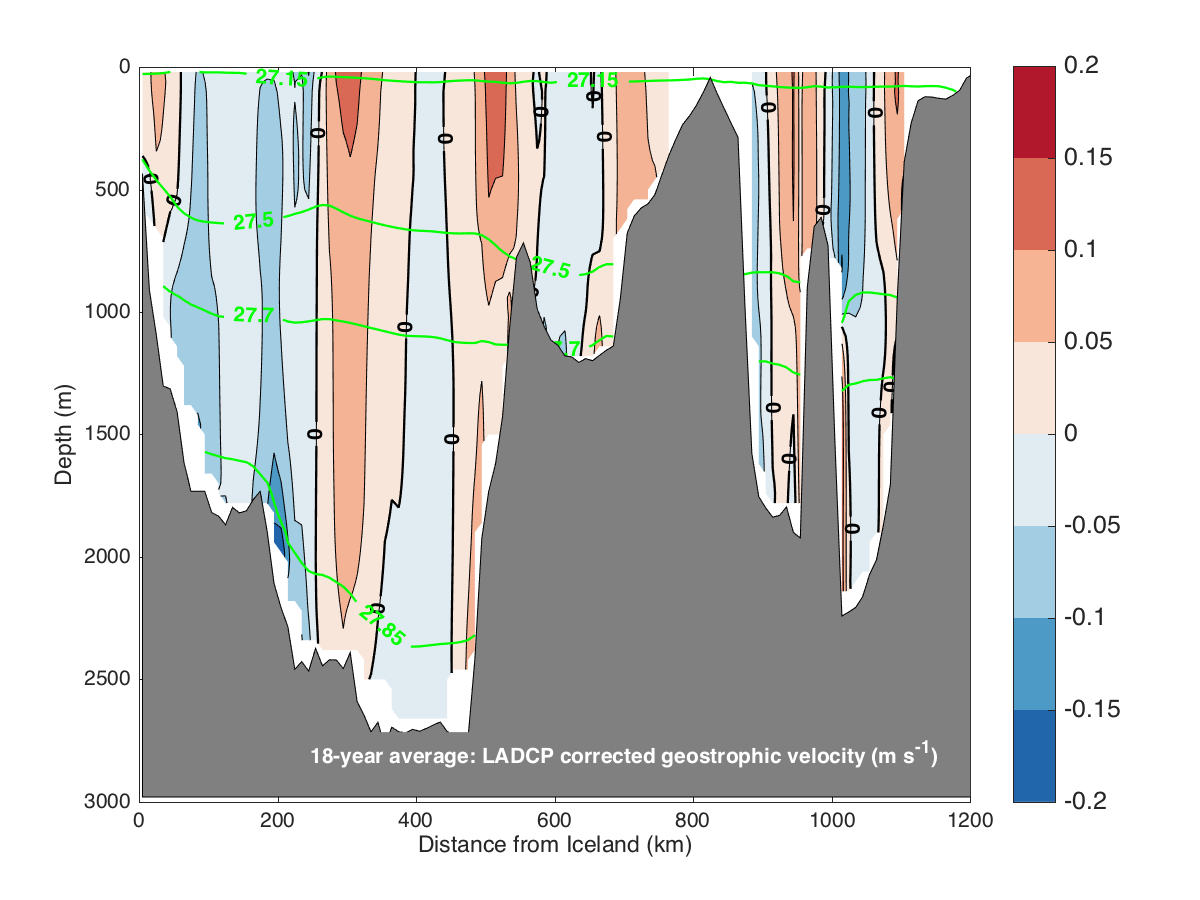
Figure 5