by Nick Foukal
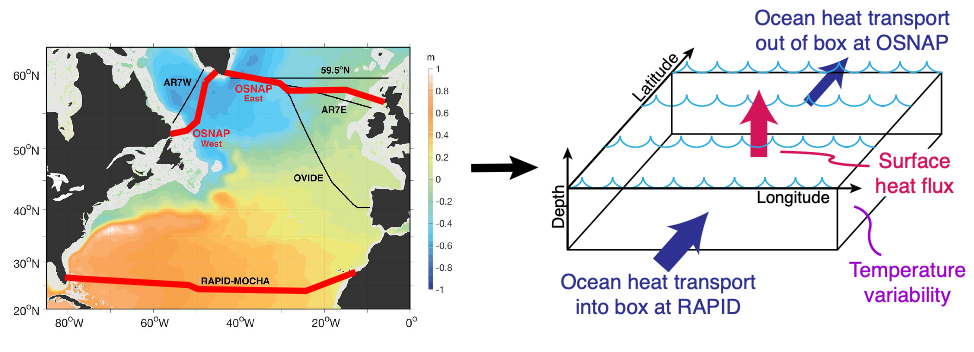
Now that the OSNAP and RAPID arrays are running concurrently, an obvious question arises: can we close a heat budget for the mid-latitude North Atlantic? A heat budget is a very simple concept – let us pretend that the ocean between RAPID and OSNAP is a box with an ocean flux coming into the southern boundary (at RAPID), another going out of the northern boundary (at OSNAP), and surface fluxes exiting through the top (Fig. 1). The sum of the oceanic fluxes and surface fluxes should equal the change in the temperature of the box, meaning the heat budget is “closed” (see equation below). This is a useful exercise because determining whether the ocean temperature variability is caused by ocean dynamics or surface fluxes gives us a better idea of how the system will evolve in the future. Though this task of closing heat budgets may seem incredibly simple to the lay audience, it has never been done before for a region as large and important as the mid-latitude North Atlantic.
Ocean temperature variability = surface heat flux + ocean heat transport divergence

Figure 1 – (left) RAPID and OSNAP lines in the North Atlantic (red lines) and time-mean sea-surface height (colors). Figure adapted from Lozier et al. (2019). (right) Simplified box representation of the mid-latitude North Atlantic heat budget with ocean heat fluxes into the box at RAPID, out of the box at OSNAP, and a net surface heat flux out of the ocean.
To close the heat budget with observations, we need reliable measurements of all three terms. There are very reliable reconstructions of ocean temperature variability (from satellites and Argo floats), decent guesses of the surface fluxes (primarily derived from satellites on these scales), but very poor estimates of the ocean heat transports. The processes that govern ocean heat transport operate on such small scales that they are difficult to measure in the absence of dedicated in situ arrays. Consequently, what is often done in the literature is the ocean heat transport term is inferred from the difference between the other two terms, and the heat budget is assumed to close. But this is not completely satisfactory because the surface heat fluxes typically have significant uncertainties (more on that later), so relying on them as the “known” component in a heat budget doesn’t inspire confidence in the result.
This is where the OSNAP and RAPID lines come in – they offer an unprecedented opportunity to bound the ocean heat transports over a large region. Never before has a region of this size been this densely sampled. This means that we no longer have to rely on the surface fluxes and conservation laws to close the budget. By knowing all three terms of the heat budget, we can assess how closely we can close the budget… essentially how well do our measurements from independent platforms agree with one another?
There is still one hurdle to overcome in this problem, and that is the uncertainty in surface heat fluxes. This is not a new problem to the field, it has plagued both oceanographic and atmospheric studies for decades. There are two well-known unknowns in surface heat fluxes: (1) the time variability between different surface fluxes data sets do not agree with one another and (2) the global surface fluxes averaged over time do not integrate to what we would expect from observed ocean warming rates. I recently ran into the former concern in a recent paper (Foukal and Lozier, 2018) where we looked at the heat budget for the eastern North Atlantic subpolar gyre in two models, and the end result of our study depended on which surface flux data set we used. With respect to the latter concern, we know that from rates of global ocean warming, the global net surface heat flux must be around 0.5-1 W/m2, yet some surface heat flux products sum to almost 25 W/m2globally (Yu, 2019, Cronin et al., 2019). So there is good reason to doubt both the mean and the variability in surface fluxes, which is not encouraging.
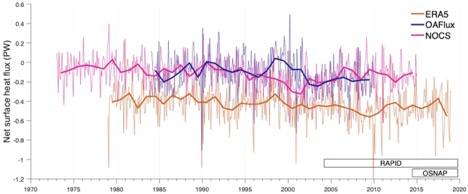
As a taste of this uncertainty, I compiled time series of the surface fluxes over the region bounded by RAPID and OSNAP for three different surface flux products (Fig. 2). To give a rough idea of what we should expect from the surface fluxes, the oceanic heat flux into the box through RAPID from 2004-2007 was 1.33 +/- 0.40 PW (Johns et al., 2011), and the oceanic heat flux out of the box through OSNAP from 2014-2016 was 0.45 +/- 0.02 PW (Lozier et al., 2019). If we assume that these two time periods are representative of the long-term mean, and that the ocean is in steady-state (i.e. the temperature variability is zero when time-averaged), then we should expect the surface heat fluxes to equal the difference between the two oceanic heat fluxes, or 0.88 PW out of the box. Instead, the mean surface heat fluxes are 0.43 PW (ERA5), 0.11 PW (OAFlux), and 0.11 PW (NOCS), all directed out of the box. While it is encouraging that the sign of the fluxes is correct in all three products and that two of the products agree with one another, it also means that somewhere between 0.45-0.77 PW is missing in our heat budget. To put this another way, at least an entire OSNAP of heat transport is missing from this budget, and maybe more. Furthermore, the only statistically-significant correlation between the time series is a relatively weak (r=0.56) connection between the annually-averaged ERA5 and OAFlux. NOCS had no significant correlations to either of the other two. So overall, the spread between the three data products, their lack of coherent variability, and their disagreement in the mean with the net ocean heat divergence does not inspire confidence that we can close a heat budget for the mid-latitude North Atlantic.

Figure 2. Surface heat flux variability integrated over the region between the RAPID and OSNAP arrays in three surface flux products (positive downward; units are petawatts = 1015 W). The thin lines are at monthly resolution, and the thick lines are annually-averaged. The seasonal cycles are removed from the monthly data to consider the non-seasonal variability. The ERA5 (Copernicus Climate Change Service) reanalysis is a ¼° product covering 1979-2018. The OAFlux (Yu et al., 2008) data set covers 1984-2009 at 1° resolution. The NOCS (Berry and Kent, 2011) surface heat fluxes are produced at 1° resolution for the period 1973-2014. The RAPID and OSNAP time periods are shown in the bottom right.
Before we lose hope, it is worth revisiting some of our methods and assumptions: (1) can we really compare the RAPID meridional heat transport from 2004 to 2007 to the more recent RAPID data from 2014 to 2016? Are the heat transports at RAPID from 2014 to 2016 perhaps lower than 1.33 PW? Lozier et al. (2019) report a net heat transport divergence of 0.80 PW between RAPID and OSNAP for the 2014 to 2016 period, which accounts for 0.08 PW of the missing heat fluxes. (2) Can we prioritize the ERA5 time series because it is the highest resolution and the most recently-released of the three products? During the 21 months of published OSNAP data, the mean ERA5 heat flux was 0.57 PW, or 33% larger than the 1979-2018 mean. So if we believe ERA5 over OAFlux and NOCS, then we are only missing 0.23 PW (0.80 PW – 0.57 PW), or only half of an OSNAP! (3) Maybe the ocean was not in steady-state for the OSNAP period (2014-2016), and instead of zero temperature change, the ocean actually warmed considerably? This is a bit of a stretch, as 0.23 PW would be a lot of warming. But it would be worth considering how much the region did warm over this time period to see how it affects the heat budget. After all, each of these heat transports has associated error bars, so maybe we can get close enough so that the error bars explain the residual? I will leave this analysis to further work, as this blog post is getting closer and closer to possible publication material…
So where does this exercise leave us? Surface heat fluxes are certainly a wild-card, but recent improvements (ERA5) seem to be trending in the right direction. In the next few years, OAFlux will be updated with higher resolution, so it would be worth checking if that time series validates the higher surface flux values of ERA5. Finally, I am contractually obligated to mention that continuation of the OSNAP line in the coming years is absolutely critical to closing the heat budget for the mid-latitude North Atlantic. A longer time series would improve our assumption of steady-state in the temperature variability and provide a better understanding of the inherent time scales of the overturning in the subpolar North Atlantic.
References:
Berry, D. I. and E. C. Kent (2011). Air-sea fluxes from ICOADS: the construction of a new gridded dataset with uncertainty estimates. International Journal of Climatology, 31, 987-1001.
Cronin, M. F. and 26 co-authors (2019). Air-Sea Fluxes With a Focus on Heat and Momentum, Frontiers in Marine Science, 6, 430, doi:10.3389/fmars.2019.00430.
Foukal, N. P. and M. S. Lozier (2018). Examining the origins of ocean heat content variability in the eastern North Atlantic subpolar gyre, Geophysical Research Letters, 45, 40, 11275-11283.
Johns, W. E., M. O. Baringer, L. M. Beal, S. A. Cunningham, T. Kanzow, H. L. Bryden, J. J. M. Hirschi, J. Martotzke, C. S. Meinen, B. Shaw, and R. Curry (2011). Continuous, Array-based estimates of Atlantic ocean heat transport at 26.5°N, Journal of Climate, 24, 2429-2449.
Lozier, M. S. and 37 co-authors (2019). A sea change in our view of overturning in the subpolar North Atlantic, Science, 363, 516-521.
Yu, L., X. Jin, and R. A. Weller (2008). Multidecade Global Flux Datasets from the Objectively Analyzed Air-se Fluxes (OAFlux) Project: Latent and sensible heat fluxes, ocean evaporation, and related surface meteorological variables. Woods Hole Oceanographic Institution, OAFlux Project Technical Report. OA-2008-01, 64pp. Woods Hole, Massachusetts.
Yu, L. (2019). Global Air-Sea Fluxes of Heat, Fresh water, and Momentum: Energy Budget Closure and Unanswered Questions, Annual Review of Marine Science, 11, 227-248.