by Clark Pennelly
The Labrador Sea in the northwestern Atlantic Ocean is a bit like salad dressing: the multiple water layers present will not happily mingle with others nearby, just like oil and vinegar. Of course, this all changes when the salad bowl that is the Labrador Sea gets stirred up! Strong winter storms pass through the Labrador Sea, cooling the surface water and making it more dense. Should this cooling process continue, the density will increase until the surface layer will have the same density as the subsurface layer, allowing them to efficiently mix together – just like shaking a bottle of dressing. We call this ‘shaking’ deep convection.
However, the Labrador Sea is not simply a 2-ingredient salad dressing mixture. A fresh and cold water cap is at the surface; this water originates from the Arctic and could be from melting of Greenland glaciers, sea-ice from the Beaufort Sea, or even runoff from one of the many rivers which discharge into the Arctic Ocean from Canada, northern Europe, and Russia. A warm and salty layer of water from the Atlantic Ocean exists below this. Further below is yet another water mass which is cold and salty, a product of mixing the two layers above it during the cold winter; we call this layer Labrador Sea Water. There are even more layers beneath, but I won’t get into them for now. These top three layers are important to the deep convection and water mass formation that previous blog posts have discussed.
My PhD thesis revolves around the ocean layers within the Labrador Sea and how they are modified by a variety of sources, such as an input of freshwater, heat, or perhaps changes in the weather. As this region is notorious for its rough seas, particularly during the stormy winter, research cruises (see https://www.o-snap.org/fleur-de-sel-life/ ) tend to occur/gather data after the winter has passed when seas are calmer and the 12-point Beaufort sea state scale (see https://en.wikipedia.org/wiki/Beaufort_scale) goes from 10’s and 11’s down to more manageable single digits. Unfortunately, research cruises may therefore miss clues about the mixing and formation of water layers that happen during the convective season. I use computer models to investigate what may be occurring when research cruises are not around to gather data. While they are not without their own set of problems, models allow us a peek into the unknown from the comfort of a Beaufort 0 sea-state office.
One portion of my research explores rotating circular features, which we call eddies, that form off the west coast of Greenland. These eddies are produced via changes in the seafloor nearby. As the West Greenland Current moves alongside the west coast of Greenland, it carries both fresh and cold water at the surface as well as salty and warm water below. These eddies carry both water layers away from the coast and into the heart of the Labrador Sea. Both of these water masses impact the Labrador Sea in a different way, so these eddies are rather interesting and important features. However, these small events are notoriously difficult to represent within numerical models, especially multi-decade simulations. We had to get a little creative in order to make sure we would resolve these eddies as modelling such eddies requires a lot of computing resources. We set up a complex simulation which has a resolution of 1/60 of a degree, meaning this simulation should be able to resolve features where are larger than a few kilometers. The simulation requires over 600 CPUs and about 72 hours of real time to produce 40 days of simulation time. To put that into perspective, our regular simulations may use 60 CPUs and finish 2 years of simulation time in 72 real hours; quite the difference! We are interested in running this expensive simulation across 17 years, from 2002 to 2018, so we can capture variability across many years, though some quick math says that this simulation will take about a year to finish. But what do we gain by resolving the Labrador Sea at high resolution?
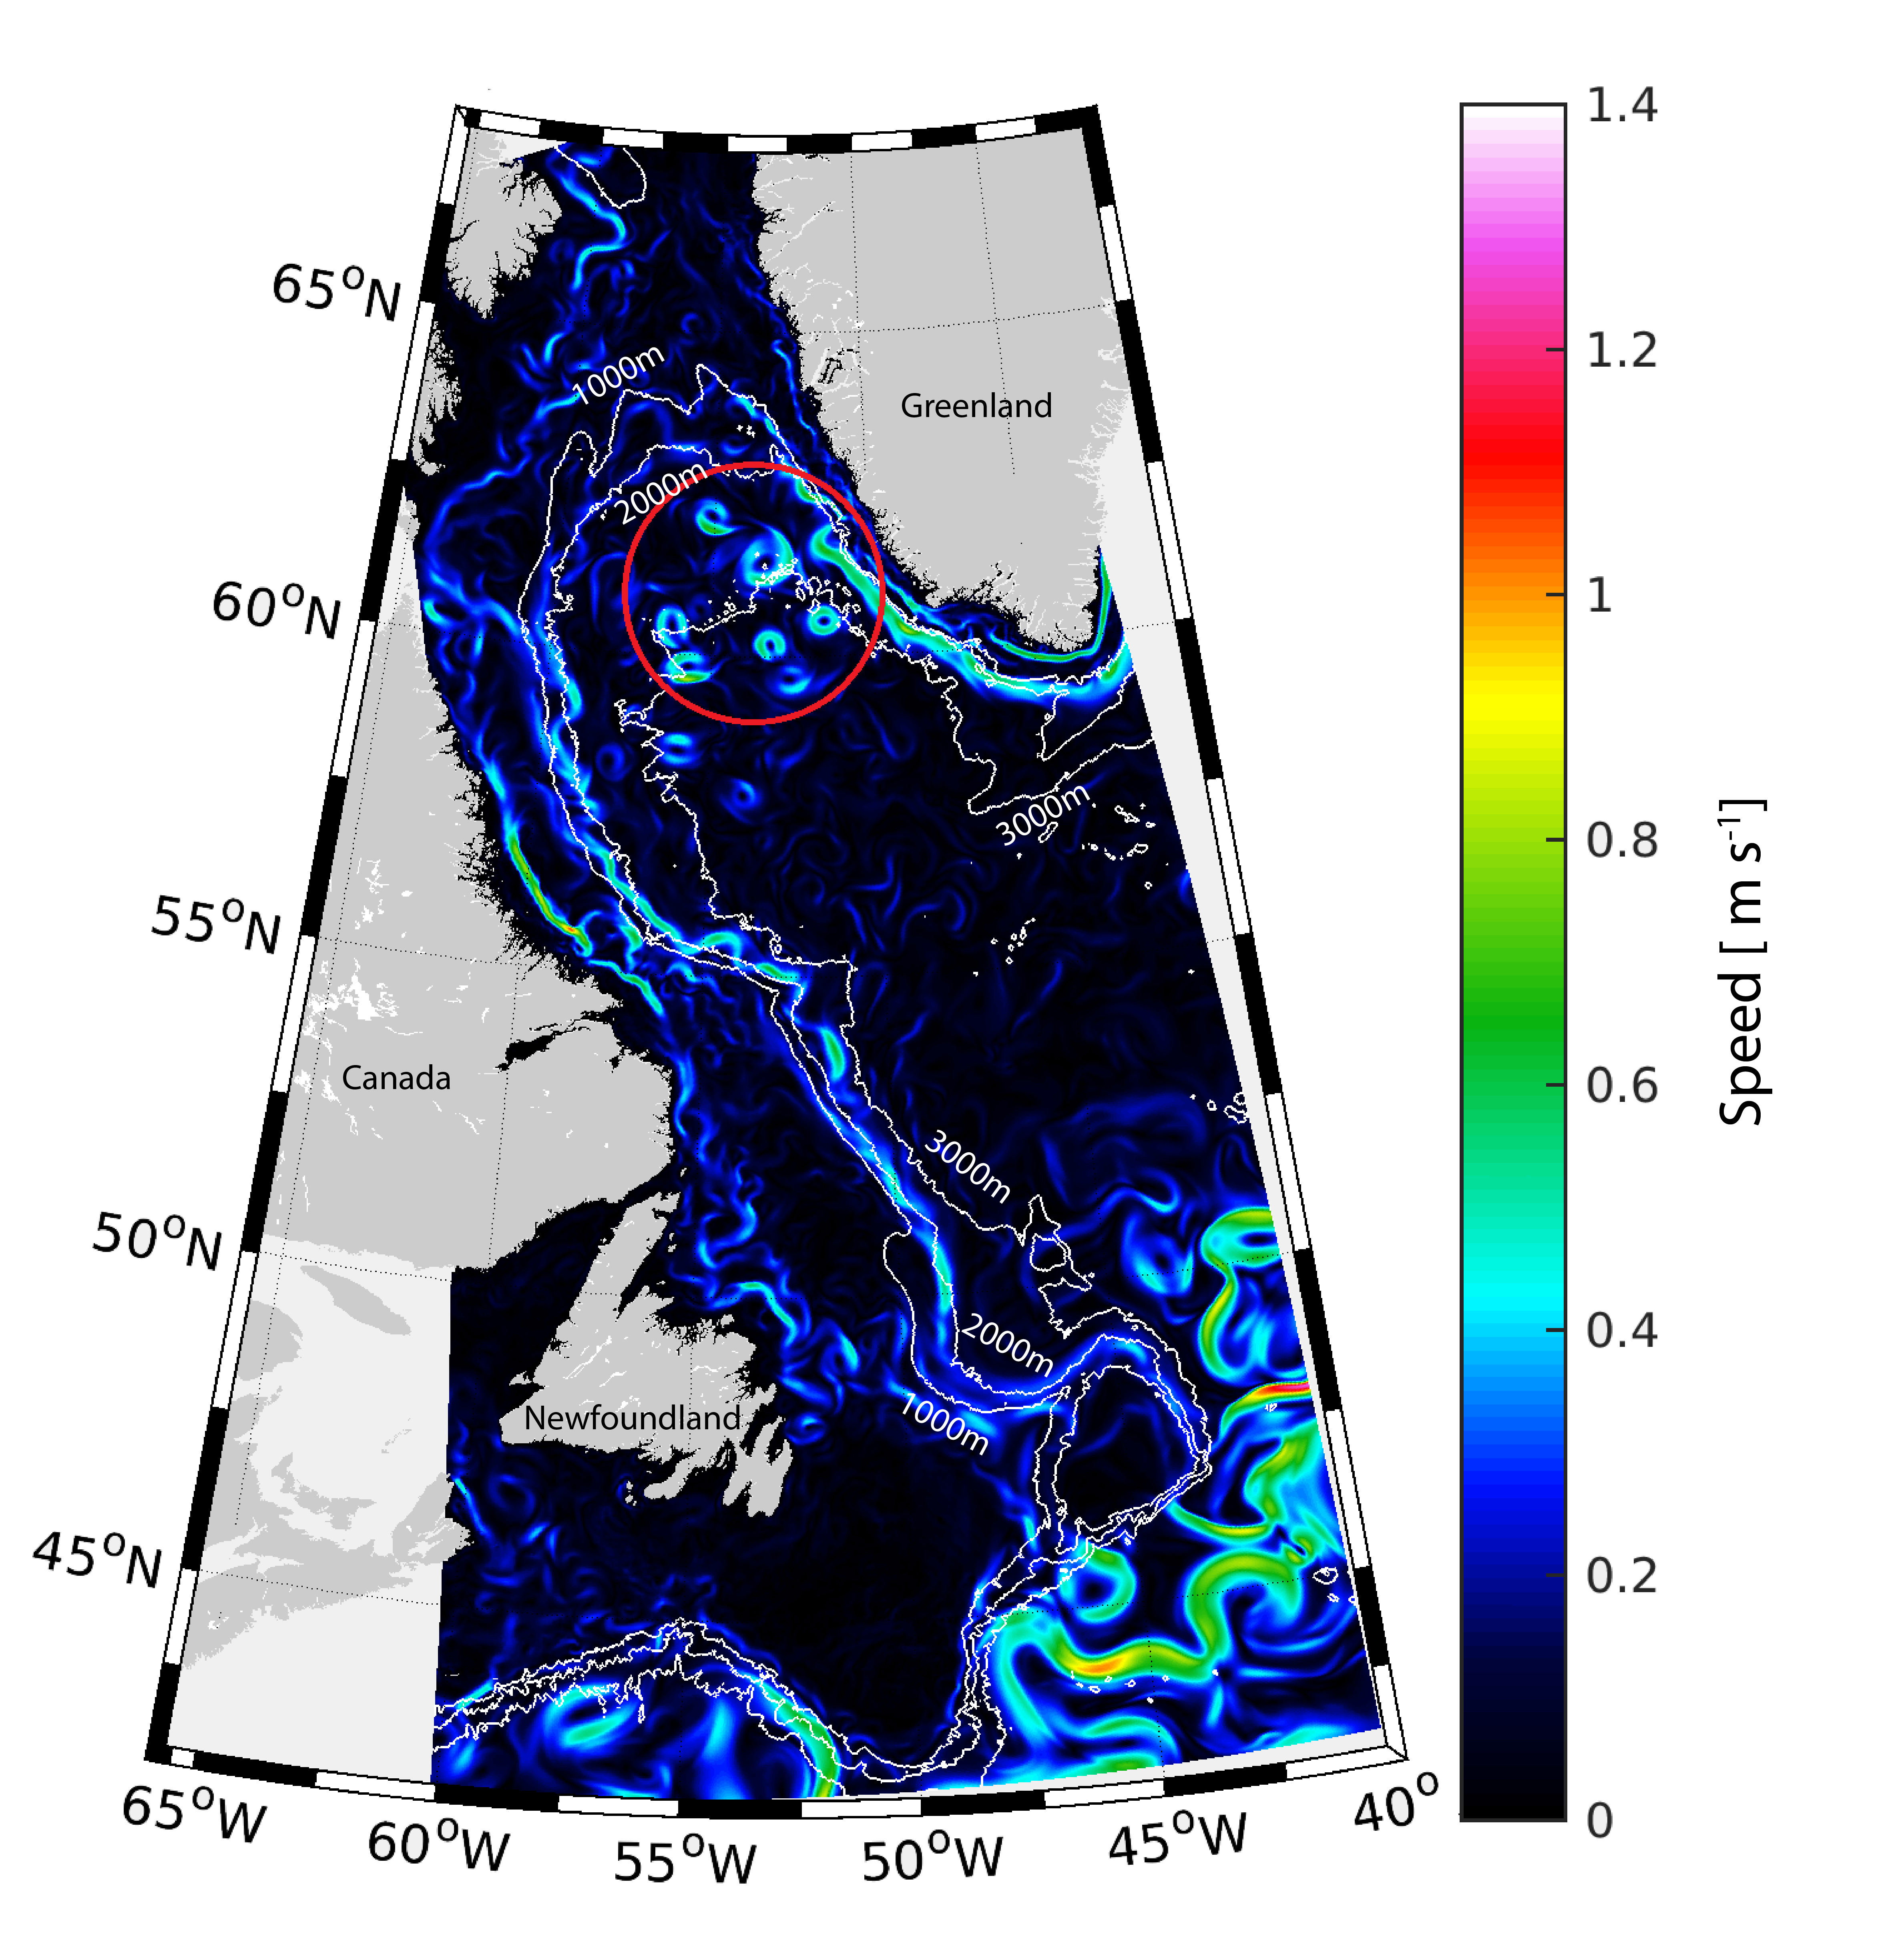
Well-defined eddies is what we get! You can see those individual eddies within the red circle. From running this model we’ve so far learned that those eddies can last up to two years, meaning that as they travel southwest from the coast of Greenland they may encounter multiple winters and therefore be involved in multiple rounds of deep convection. I’m currently exploring how these eddies evolve through their lifetime in the Labrador Sea. We know they bring substantial heating into the region, limiting deep-water formation. Thus being able to detect them with our model is crucial in order to achieve an accurate spatial representation of convection. Lower resolution simulations may fail to resolve these features and thus their importance. Since they persist for multiple convective years, they may have a more complicated story than previously thought which I hope my research will help uncover. Numerical modelling allows for the scrutiny of such events as observations within the Labrador Sea may not provide the full information we seek.