by Ryan Peabody
Scientists and marine technicians have long appreciated the productivity-increasing role of caffeine [citation needed]. However, quantitative assessments of caffeine consumption and usage among the members of the DY054 science team have not yet been performed. Herein, we perform a not-quite-exhaustive nine-day analysis of tea and coffee consumption on the RRS Discovery. No significant trends were observed, other than a general preference for tea over coffee, and a sharp decrease in enthusiasm for the study as it progressed. Further work is needed to determine whether or not bush tea counts as a cup of tea, and exactly what quantity of coffee counts as a colloquial “cup.”
Data were self-reported via “marker and whiteboard,” following methods developed in Mrs. Cooper’s second grade class [Cooper et al., 1999]. Logging was originally intended to take place daily at 23:59:59 UTC, but the lead scientist occasionally felt “really over it” and data were not recorded until the following morning. Efforts were taken to ensure that subjects maintained standard patterns of caffeine consumption, though it is worth noting that several believed the study to be a contest to see which one of them could drink the most coffee.
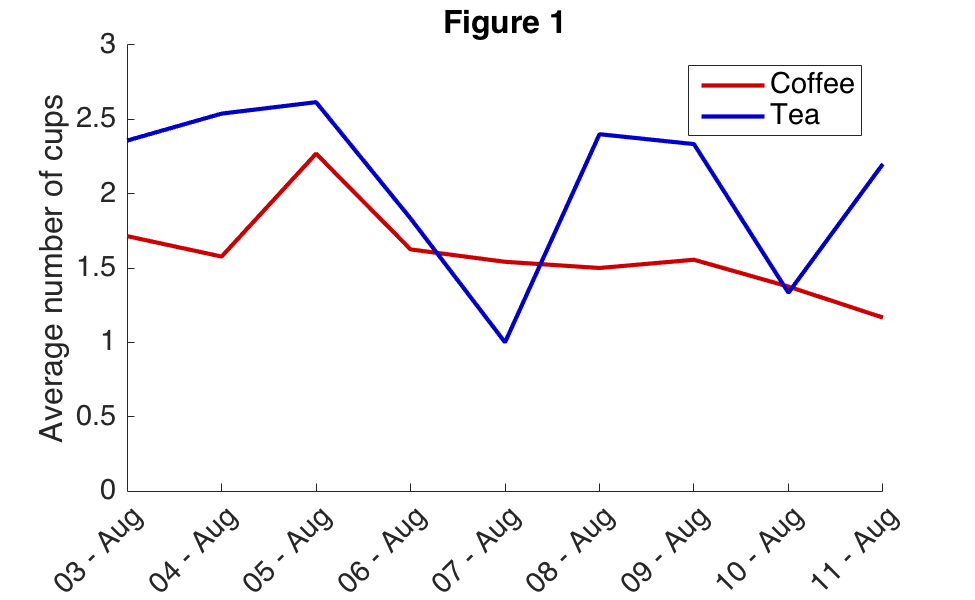
Coffee and tea consumption demonstrate a general downward trend over the nine days, both passing a Mann-Kendall test (Figure 1). A 0.377 coefficient of cross-covariance implies that coffee and tea consumption are not related at any reasonable confidence level. Tea was consumed in generally higher quantities: on average 2.1 cups/person/day to coffee’s 1.6 cups/person/day. Further study is needed to determine if this is standard on a British flagged research vessel. Initial data supports this hypothesis: American-born members of the science team consumed 2.8 cups coffee/person/day and 1 cup tea/person/day, while British nationals consumed 1.3 cups coffee/person/day and 2.2 cups tea/person/day. The sole Hungarian-born member of the science team consumed an average of 6.1 cups of tea per day and 0 cups of coffee.
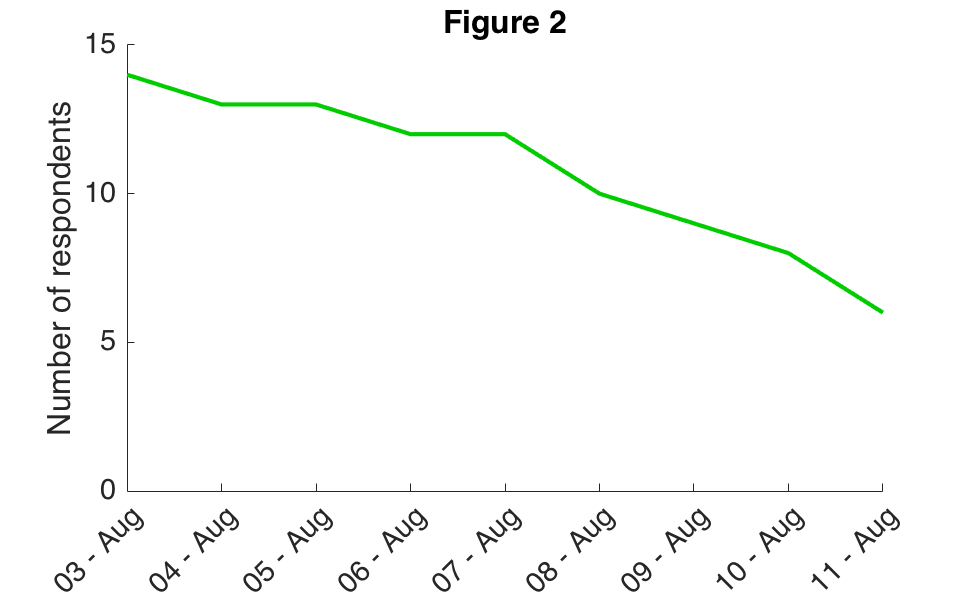
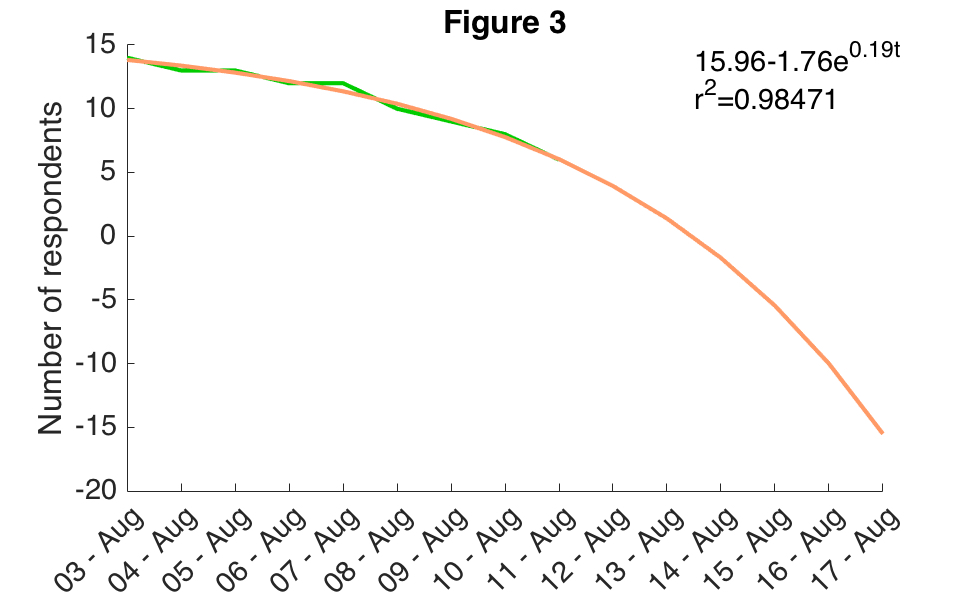
Over time, a noticeable lack of enthusiasm for the study is evident, with participation dropping from 14 initial participants on day 1 to 6 participants on day 9 (Figure 2). On a ship with 45 crew and scientists on board, this represents a drop from “low” to “very low” participation. Despite the decrease, 70% of participants reported feeling “fair” to “good” about their own caffeine consumption and the study, indicating that maybe no one was really paying attention to the study in the first place. A least-squares fit of a nonlinear model of form b(1) + b(2)*exp(b(3)*t) represents the data very well, but also indicates that it was wise to end the study on day 9 (Figure 3). If the study had continued until the scheduled arrival in Southampton, approximately -15.5 responses would be logged each day, indicating that study participants would begin to erase the previously collected data, invalidating the entire study.
Clearly, further study is needed to determine: 1) exactly how much caffeine is being consumed on board, 2) why no one wants to log their daily caffeine consumption, and 3) whether or not this was a good use of my time. Caffeine is a widely-consumed but little-studied product in the context of oceanographic research vessels, with most scientific effort going toward measurements of physical, chemical, and biological properties of the ocean. Though oceanographic research vessels are built and used primarily for the latter three areas of research, there is no apparent reason not to also study caffeine consumption.
Images by Ryan Peabody