by Roos Bol
Now that temperatures outside are dropping and storms are raging over the subpolar gyre, it is clear that the OSNAP field season had ended. Many blogposts have been written about the exciting adventures at sea last summer. This time however, I would like to tell you a bit about the – slightly more boring – work that happens after. When the exhausted but ultimately satisfied scientist returns home, with a hard drive full of newly recovered data; that’s when our real work begins. Before the new data can be used to answer actual science questions, they are in dire need of some cleaning.
Why is that necessary? Instruments on a mooring (a cable anchored to the sea floor) are impacted by currents, storms, tides and sometimes fishing activities. There is the risk of colonization by omnipresent sea creatures. In the vast open space of the ocean, an instrument can provide a welcome place for shelter. Instruments deployed in the sunlit surface layer are all overgrown with algae upon recovery. But deeper instruments can also host interesting inhabitants, such as the anemone in the picture below. Last but not least, the ocean is salty, wet and under high pressure. A challenging environment for an electronic instrument, especially with our long deployment period of two years!
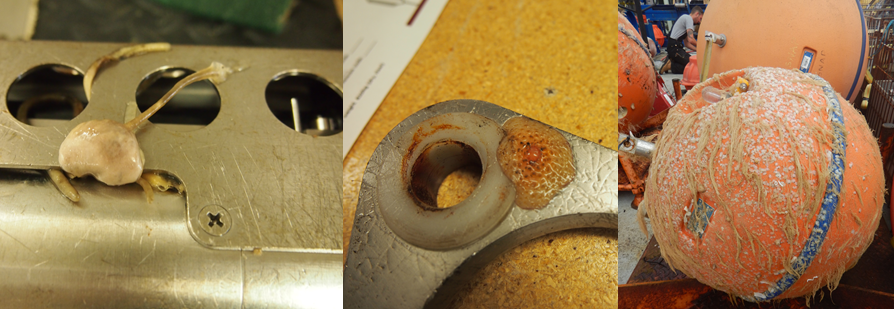
Figure 1: Some examples of sea life on the moorings upon recovery: a slimy creature on a Microcat, an anemone growing on a ring of the release that was at almost 2000m depth, and a shallow UK buoy overgrown with algae.
Data quality sometimes suffers from all these environmental impacts. This is where my work of the past few weeks comes in: checking, cleaning and processing the raw data records. Below are examples of Microcats on one of our moorings, called IC2, during the last deployment. Unlucky for us, the anchor of this mooring ended up shallower than planned, on top of a small seamount. A storm resulted in the exposed top buoys breaking down, making the shallow instruments sink to the deep. The top Microcat, originally at 25m, was instead dangling loose at around 700m depth… it is a small miracle it was still attached to the cable when the mooring was recovered!
(For those who are wandering; yes, luckily there was another buoy at 350m, keeping the deeper part of the cable standing up straight!)
Severe storms impact the mooring even deep down in the water column. The pressure record of the Microcat at 352m depth (figure 2) still shows many big and small ‘blowdown’ events. During such an event, strong currents push against the mooring cable, blowing it down at an angle and pushing the instruments deeper into the water. When the storm ceases, the buoys on the cable pull the mooring cable back to its original straight position.
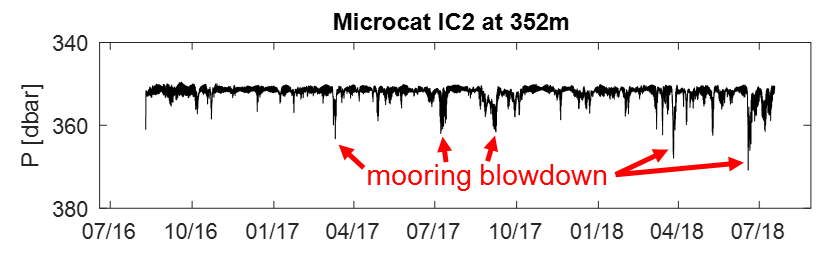
Figure 2: Pressure time series of the Microcat at 352m in mooring IC2 for the last deployment (August 2016 to July 2018)
Microcats also measure temperature and salinity. Figure 3 shows the raw salinity record from the deepest Microcat on IC2, close to the bottom at almost 1900m depth. As you can see, salinity differences in the deep ocean are generally very small. However, salinity measurements are notoriously noisy, so we need to perform some filtering of data spikes. But which spikes are bad data, and which represent real variability? Then there is a suspicious drop at the start of the record; perhaps a small animal or algae was temporarily covering the sensor?
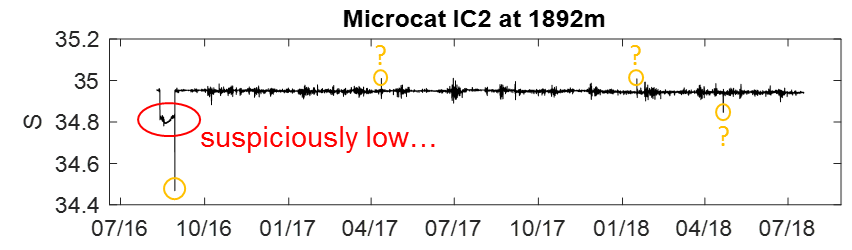
Figure 3: Raw salinity record from the deepest Microcat in IC2, at 1892m
Lastly, and perhaps most importantly, we need to perform a calibration for all sensors. From the ship, we dip the instrument into the ocean and test its readings against a calibrated reference sensor to determine any offsets, both before and after the deployment. This is the only way to check whether an instrument gives accurate readings.
Overall, it is probably clear that there is a lot of effort involved in scrutinizing the records and ensuring data quality control is performed correctly. But although it may sound a bit tedious, the quality control step is extremely important. It ensures that we have accurate, reliable records, on which we can build for further analysis – to eventually formulate valid answers to scientific questions!