Observing elements
Click here for the deployment information for all OSNAP elements.
Configuration
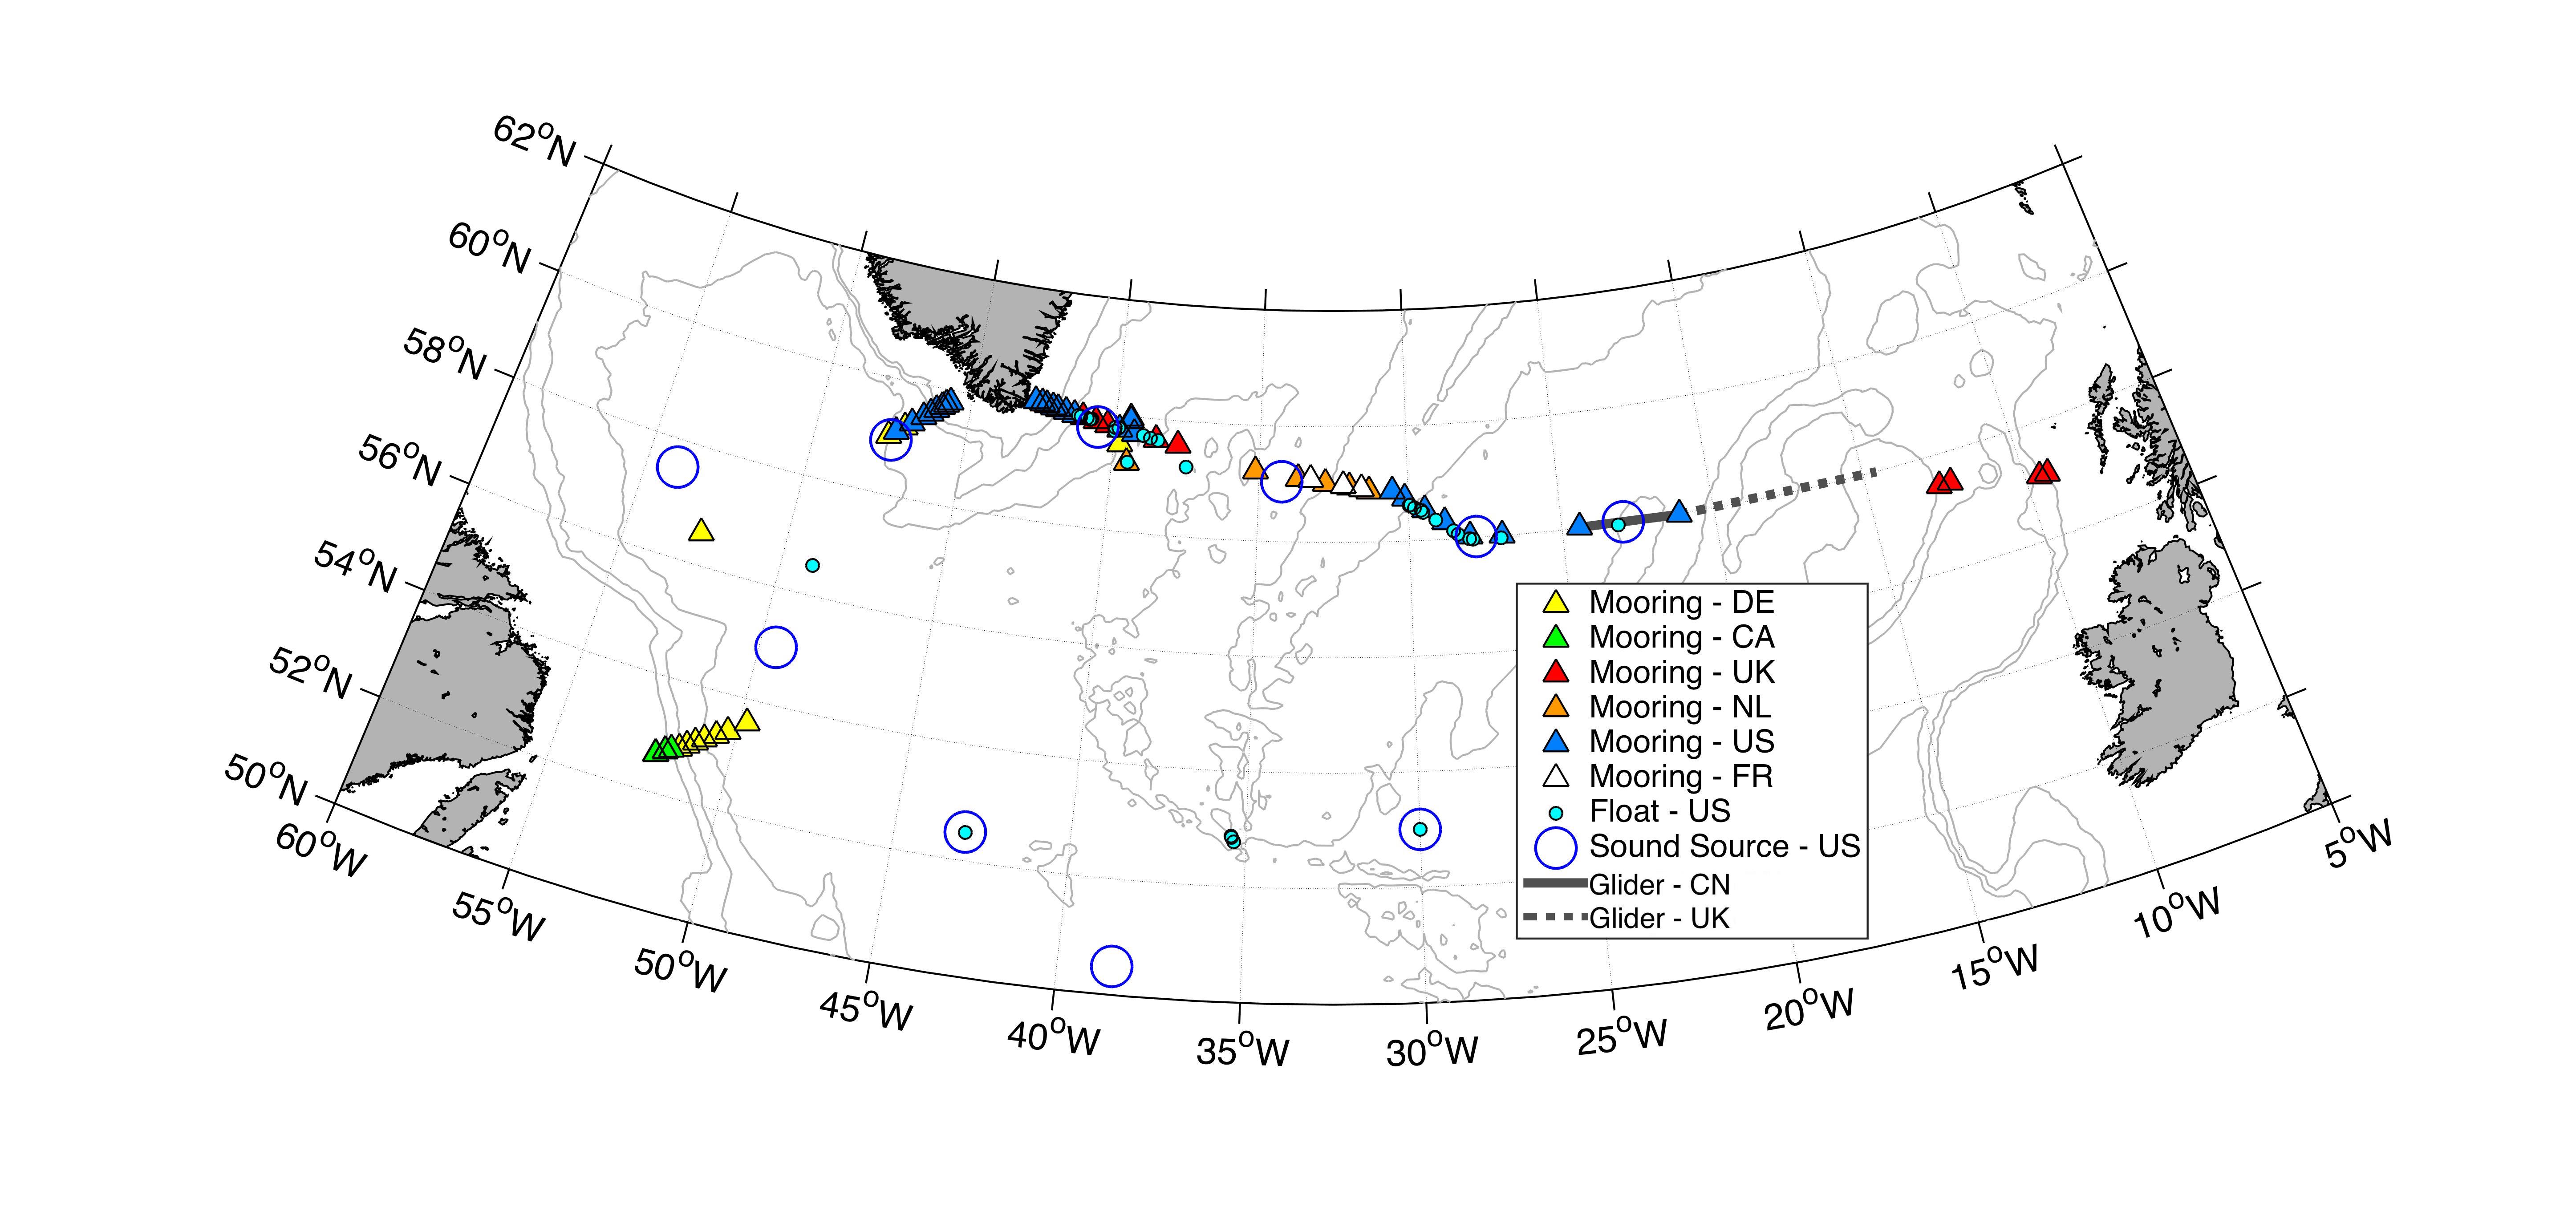
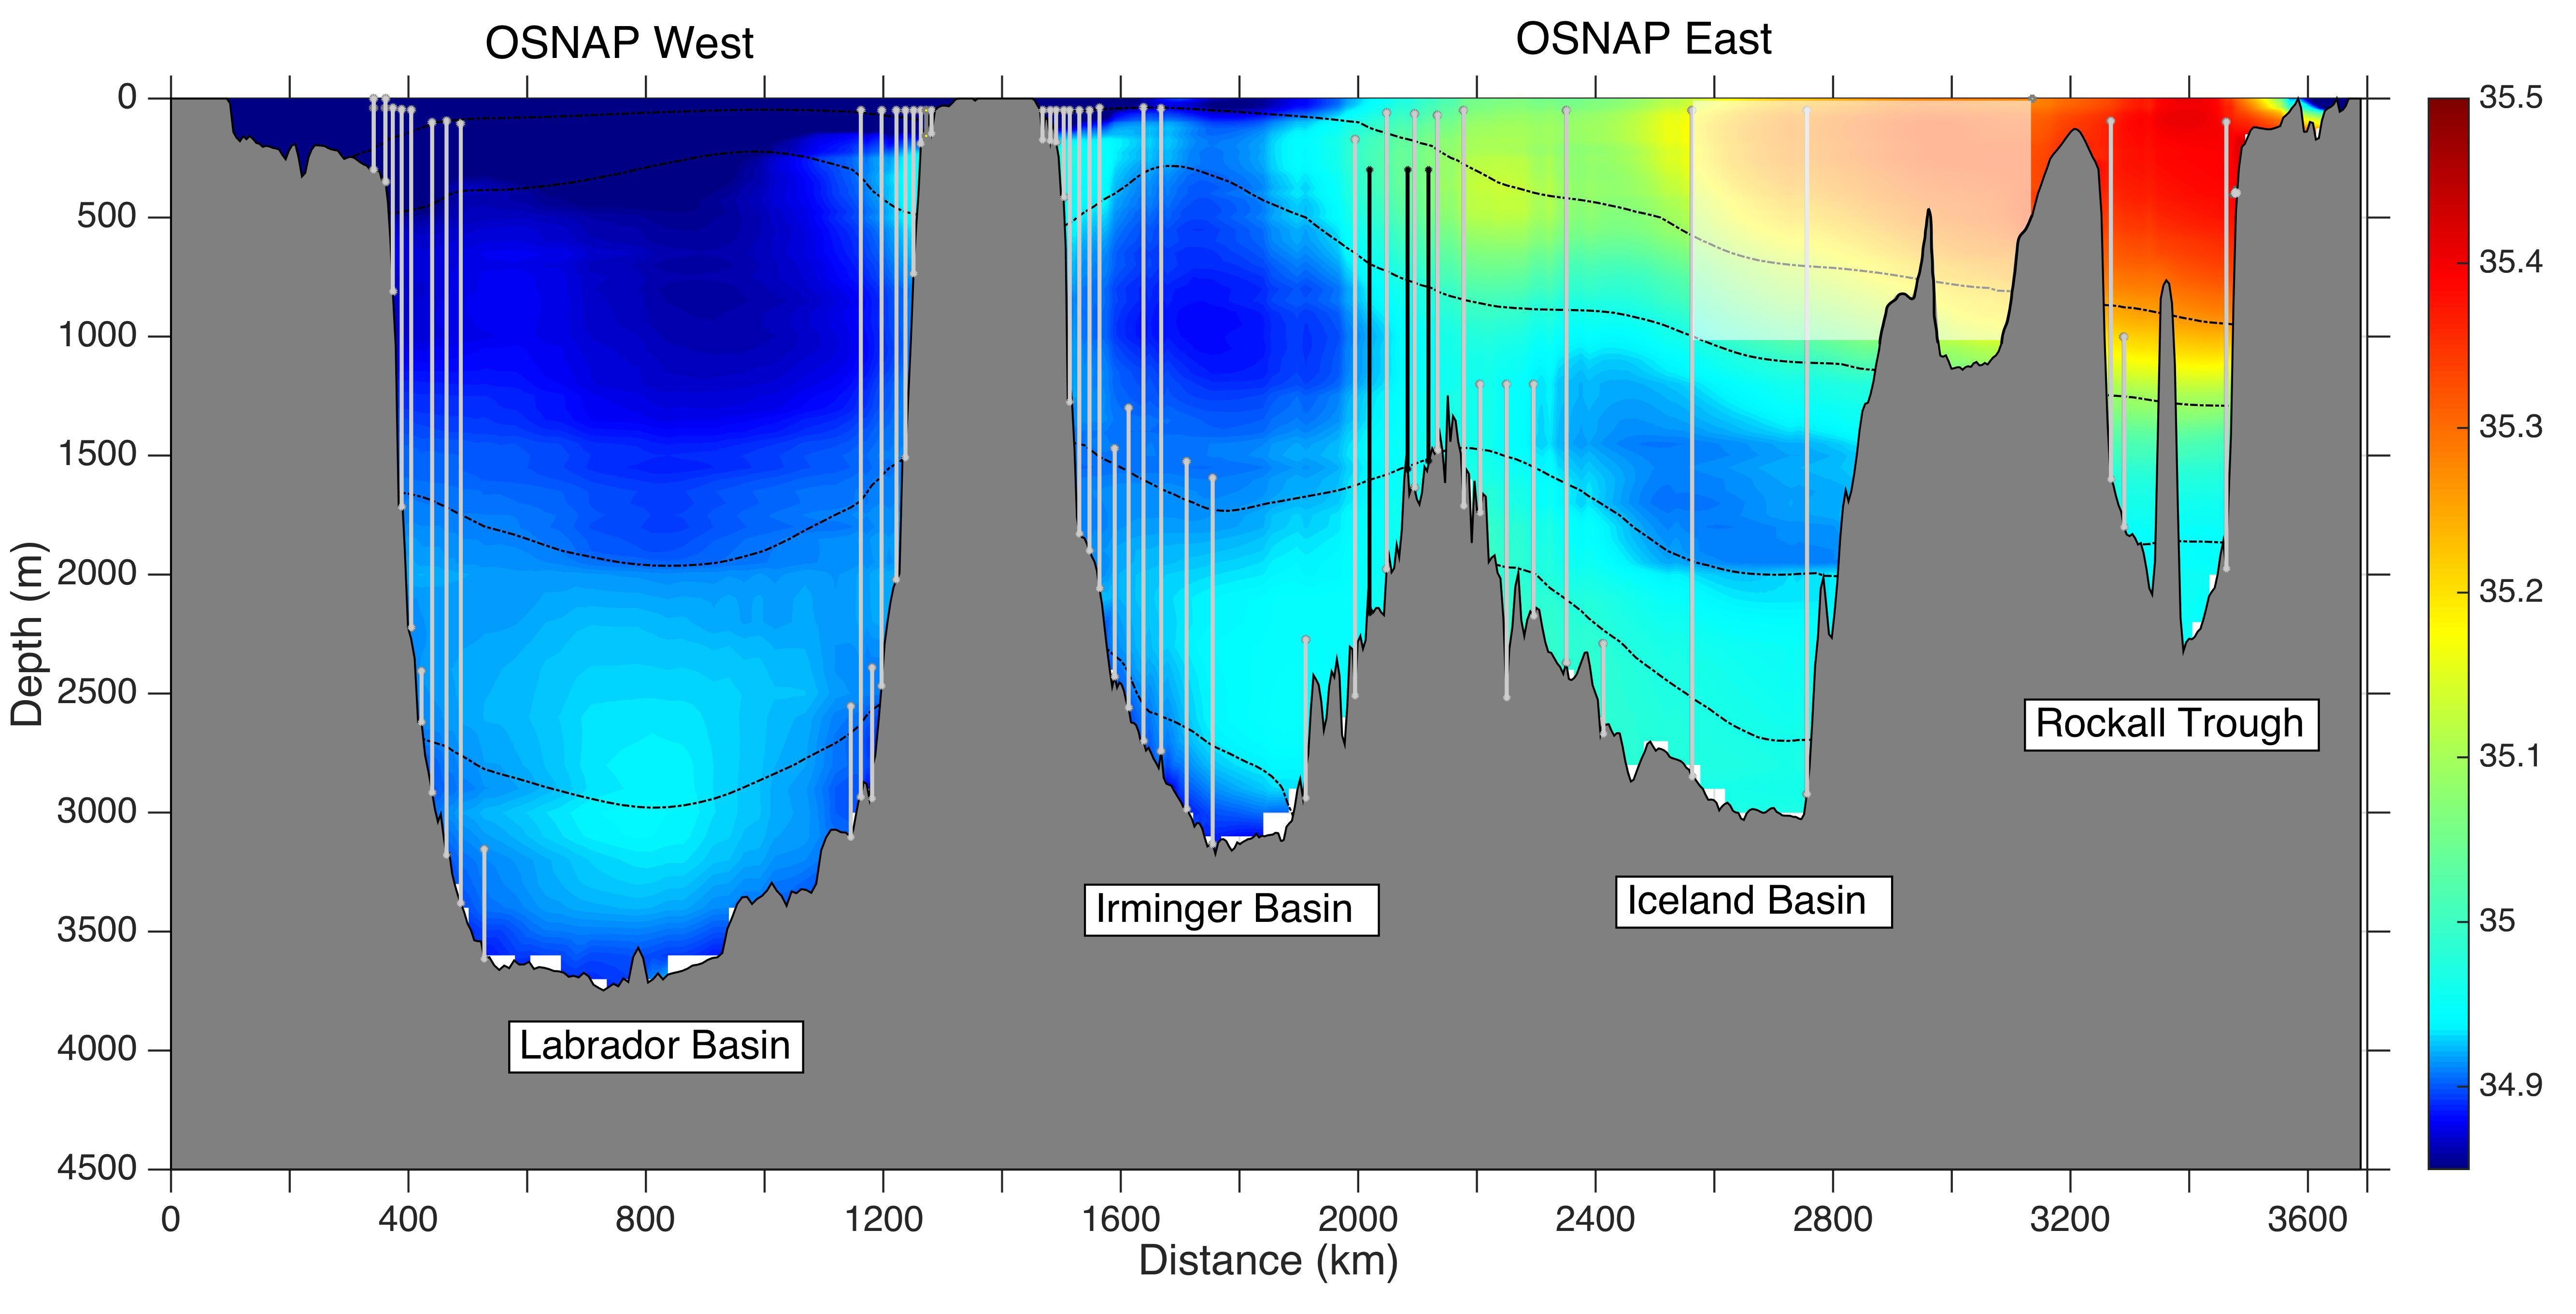
OSNAP is configured as a trans-basin observing system, across which AMOC metrics are measured using a combination of fixed current meter arrays, repeat hydrographic occupations and gliders. The OSNAP line consists of two legs: OSNAP West extends from southern Labrador to southwestern Greenland and OSNAP East from southeastern Greenland to the coast of Scotland. Flows through these lines are connected via subsurface RAFOS floats that track the pathways of the overflow waters and help interpret observed variability in fluxes across the OSNAP lines. Though alternate configurations were considered, including a single zonal line across the subpolar region, two lines were chosen due to several advantages: water mass transformations and Arctic export pathways west (Davis Strait and Labrador Sea) and east (Fram Strait and Nordic Seas) of Greenland are physically separated; the equatorward evolution of the DWBC and its constituent water masses can be assessed, and the two lines optimize transport calculations since they are nearly normal to the mean flow in the region. This configuration also allows for detailed studies of water mass transformation within the three sub-basins: Iceland, Irminger and Labrador.
The two legs are situated to capitalize on a number of existing and planned long-term observational efforts in the subpolar North Atlantic: the Canadian repeat AR7W program in the Labrador Sea (although the OSNAP West line is shifted slightly southeastward to capture the export of all LSW from the Labrador Sea); the German Labrador Sea western boundary mooring array at 53°N; the US Global OOI (Ocean Observatories Initiative) node placed in the southwest Irminger Sea; the repeat A1E/AR7E hydrographic sections across the Irminger and Iceland Basins (approximately coincident with OSNAP East); and the Ellett line in the Rockall region.
Enlarged Maps
Iceland to Scotland Instrument Locations and OSNAP-East Mooring Diagram
Irminger Sea Instrument Locations and OSNAP-East Mooring Diagram
Labrador Sea Instrument Locations and OSNAP-West Mooring Diagram