by Penny Holliday
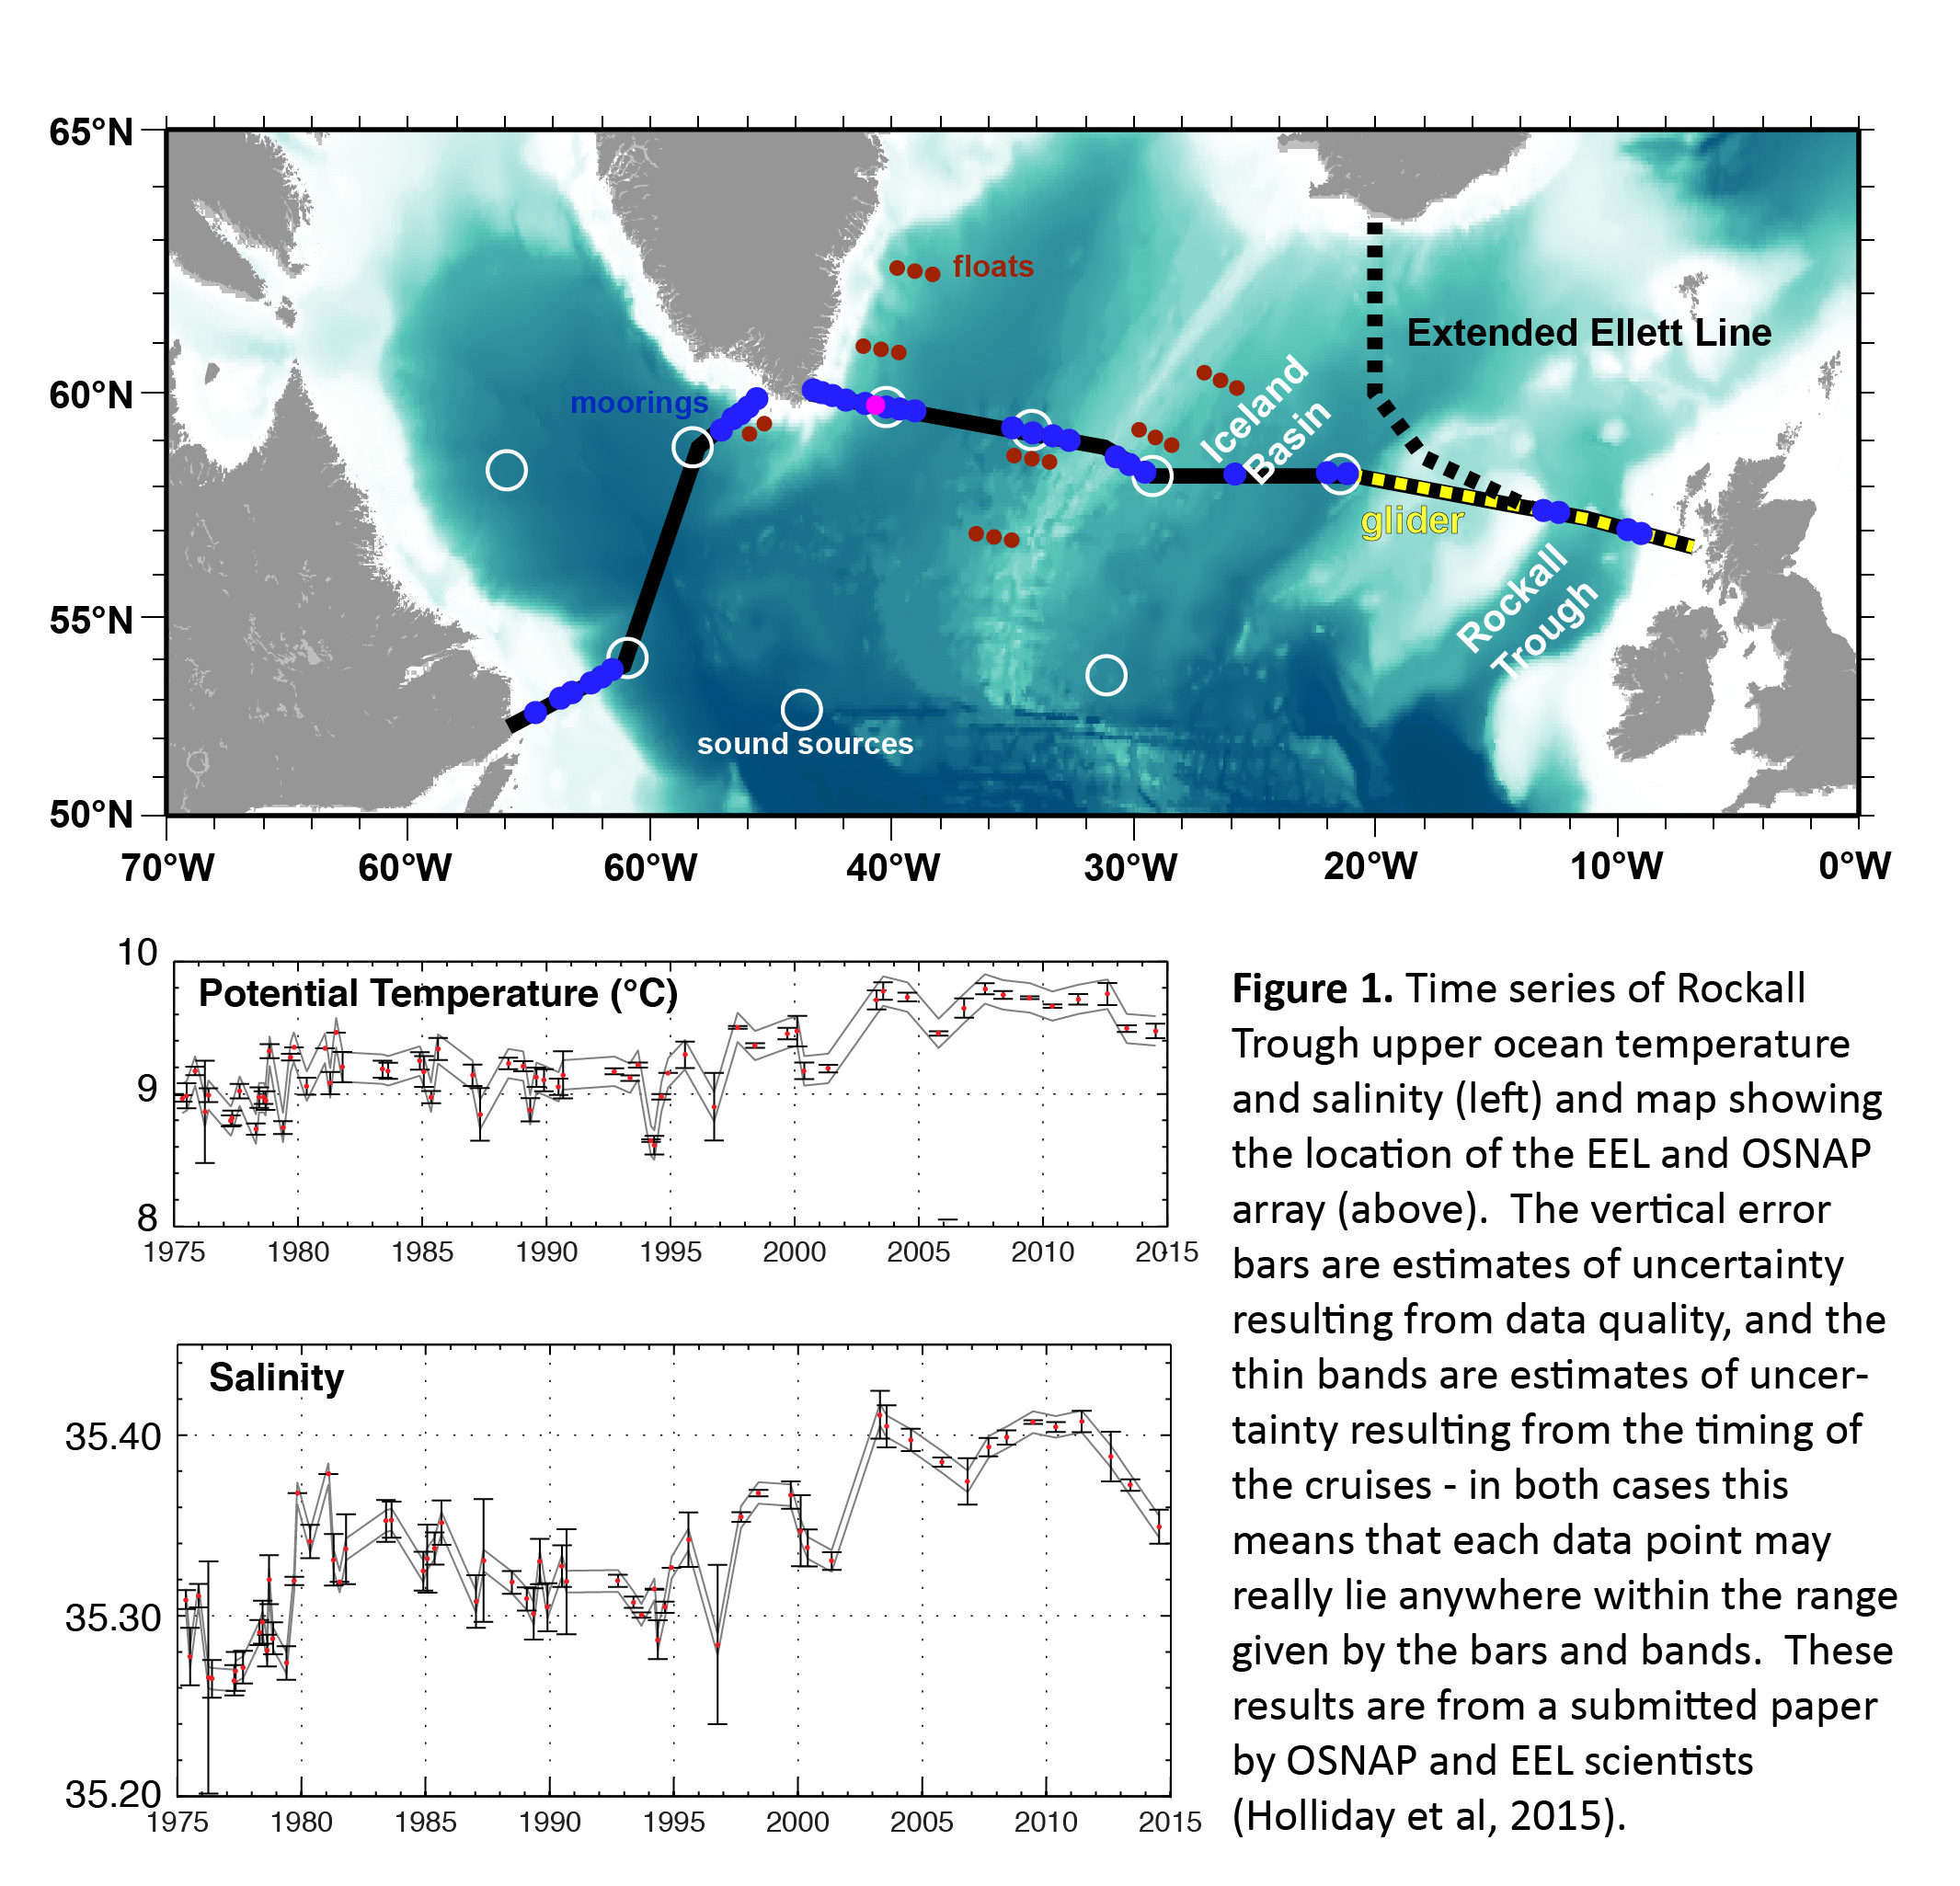
The OSNAP array is designed to meet our scientific objectives by making the most of existing measurements as well as collecting new observations. The eastern part of the array lies along part of a repeat hydrographic section called the “Extended Ellett Line”, or EEL for short. The EEL crosses the deep ocean between Iceland and Scotland, measuring the warm Atlantic water that flows from the subpolar region into the Nordic Seas and eventually the Arctic. The programme has been in place now for an amazing 40 years (1975-2015), making it a rare thing: a multi-decadal time series of high quality, deep ocean measurements. Holliday and Cunningham (2013) (http://www.tos.org/oceanography/archive/26-2_holliday.html) gives a full account of the history and achievements of the programme.
The EEL began in 1975 as a short hydrographic section across the Rockall Trough that was carried out several times a year, though rarely in the winter when the weather is hideous and waves are too big for research vessels to work (see Holliday et al 2006, http://onlinelibrary.wiley.com/doi/10.1029/2005GL025238/abstract to find out how alarming winter research cruises can be). Four decades of observations show that the top layer of the ocean (here around 0-800m) has warmed and there is a lot of shorter timescale variability (Figure 1). The salinity time series shows that there are also periods of highs and lows in salinity, each a few years in length. Look closely and you will see that the most recent years (since about 2010) have been slightly cooler and fresher than the mid 2000s, though values are still high compared to the first half of the time series. A new study of ocean heat content using Argo float data (Roemmich et al, 2015, http://www.nature.com/nclimate/journal/v5/n3/full/nclimate2513.html) confirms that the upper layer (0-2000m) of the northern buy viagra online subpolar North Atlantic has cooled since 2006 while the global ocean heat content has continued to rise. The reason for the patchiness of changes in ocean heat (and freshwater) content is ocean circulation, and OSNAP will bring us new understanding of the processes that underpin the changes we observe.
Since the mid 1990s the EEL section has reached past Rockall and run all the way to Iceland, crossing all the main paths of the North Atlantic Current (NAC) heading northwards into the Nordic Seas. We can use the two decades of data along the complete section to discover in which basins and at which depths the strongest variability can be found. It turns out that, not surprisingly, there is high variability in temperature and salinity (and density) where the NAC powers through the Iceland Basin as a continually changing train of eddies. Somewhat surprisingly, the current along the edge of the Northwest European continental shelf has low variability in T, S, density and in velocity. But the deep open Rockall Trough has the highest variability in velocity from the mid-depth thermocline up to the surface, making this an important basin to capture changes over time in heat and freshwater transport. In OSNAP we are using a combination of moored instruments and seagliders to measure those things. The EEL data tell us about year-to-year changes, and the new OSNAP measurements will give us a full understanding of changes over shorter timescales, as well as how changes here in the eastern margin relate to changes elsewhere in the North Atlantic.
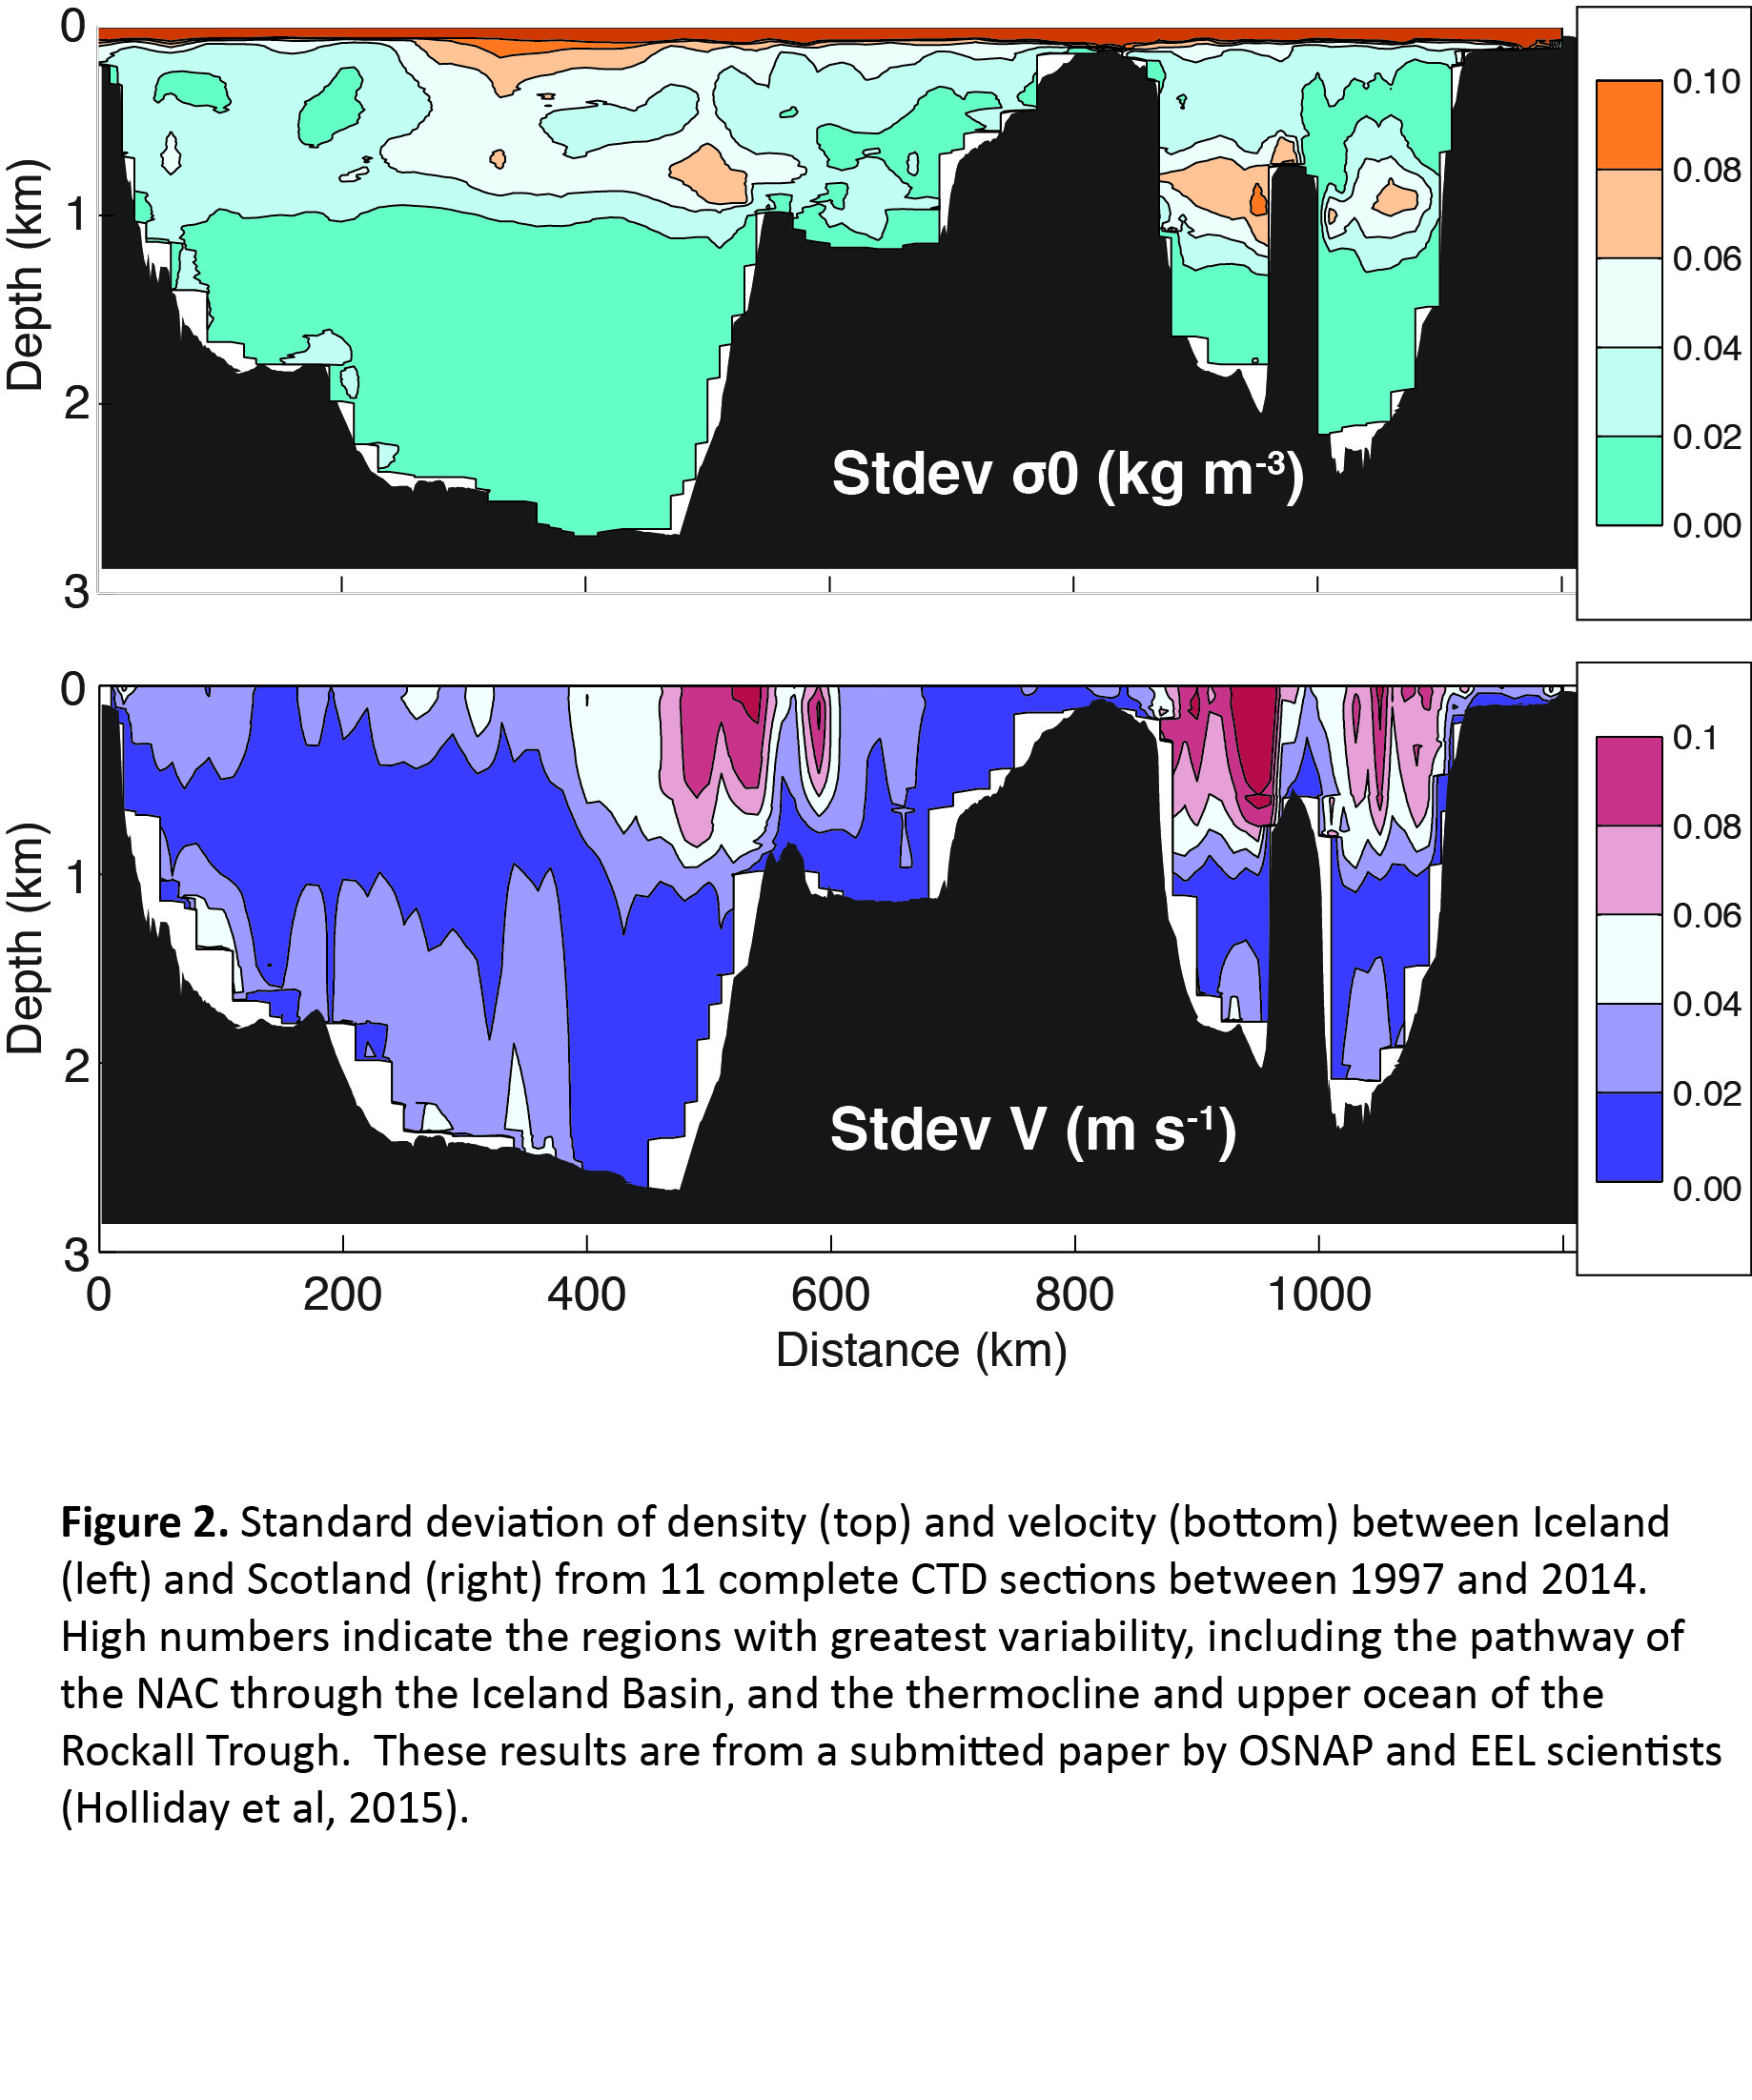
(Holliday et al 2015 is submitted to Journal of Geophysical Research – Oceans and is called “Multi-decadal variability of potential temperature, salinity and transport in the eastern subpolar North Atlantic.)