by Bill Johns
Off we go again!
Its the 2018 OSNAP field season and we are aboard the R/V Neil Armstrong, the new pride and joy of Woods Hole Oceanographic’s fleet. Pictured below is the R/V Armstrong coming into dock in the old harbor of Reykjavik, Iceland after completing two days of loading in the “new” harbor down the quay. This is my first time on the R/V Armstrong and I have been looking forward to sailing on her ever since she came out of the shipyard.
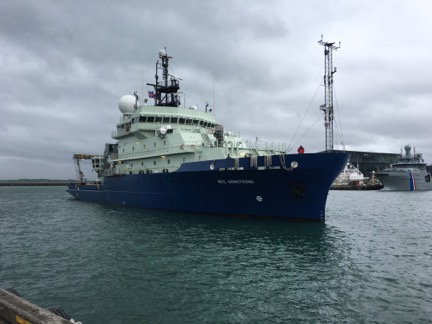
The R/V Neil Armstrong coming into dock in Reykjavik, Icleand.
The cruise has gotten off to a good start and we are now about halfway through our month-long voyage. We have three science groups aboard, from the U.K. (the Scottish Association for Marine Sciences and the National Oceanography Centre, led by Dr. Stuart Cunningham), from Holland (the Royal Netherlands Institute for Sea Research, led by Dr. Femke de Jong), and from the U.S. (the Rosenstiel School of Marine and Atmospheric Science, University of Miami, led by myself). We have a lot to accomplish on this cruise, and it still boggles my mind how many mooring operations we are planning to do on this one cruise. Altogether we have 21 moorings to recover and 19 to deploy, most of which are mooring “servicing” operations, meaning that we recover and redeploy a replacement mooring at the same site, usually on the same day. The deck is full to the bulkheads with mooring gear, and many of the crew have commented that they have never seen the deck so full. Thanks to the ingenuity of the deck crew and mooring teams we managed to find a place for everything (whereupon I can now admit that I was secretly worried whether we would actually fit everything onboard!).
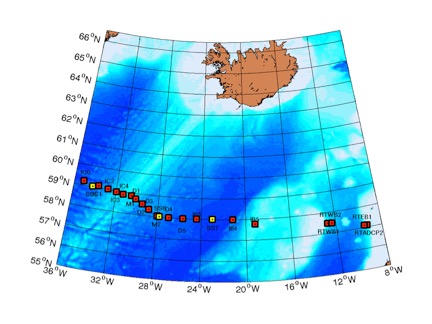
The array of moorings to be serviced on the OSNAP East 2018 cruise.
In addition to the mooring operations, we plan to complete a full line of CTD stations across the entire array, amounting to some 80 stations in total. At these stations we will be measuring full depth profiles of currents, water properties (temperature, salinity, and dissolved oxygen), and also drawing water samples for chemical analysis including dissolved inorganic carbon, nutrients, and nitrogen and silica isotopes.
Whew!
So far we have had very reasonable working weather, except for having to dodge the remnants of tropical storm Chris which came barreling through our array right where we happened to be working at the time. So, we picked up and ran to the far western end of our line to resume work there, forcing us to develop a new “Plan B” that reorganized the entire layout of the cruise.
Such is life at the mercy of the sea.
I find it ironic that during the four OSNAP cruises I have been on since we started the program in 2014, the worst storms we have had to deal with have all come up from the tropics as post-tropical storm events. So much for my plan of escaping from the summer storm season in Miami.
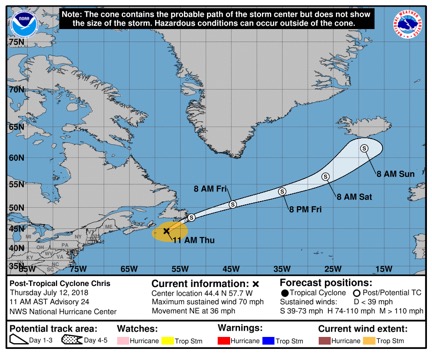
The last 5-day forecast for post-tropical cyclone Chris posted by the National Hurricane Center. The storm position on Saturday July 14th was right where we planned to be working at the time. Needless to say we decided not to stay around to see if the forecast track was correct.
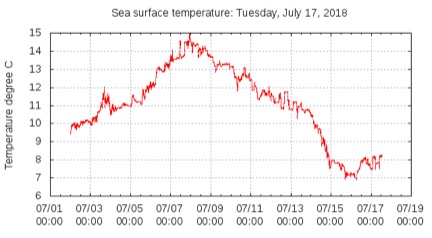
One of the truly remarkable things about these OSNAP cruises – and in particular the part of the subpolar North Atlantic that we are crossing during this cruise – is that you can feel in your skin and bones just what effect the ocean circulation is having on the climate. Part of our cruise takes place on the “warm” side of the subpolar gyre, where the North Atlantic Current brings warm waters originating from the Gulf Stream to Rockall Trough off the coast of Scotland and to the eastern side of the Iceland Basin. This is the most looked forward to part of the cruise, where ocean temperatures are as high as 14 degC and surface air temperatures rise to match it. A look out the back door to the deck often finds people who are off watch milling about aimlessly, squinting in the warm sunlight and enjoying the beauty of the sea. Then, eventually, whether we like it or not, its time to cross westward into the western Iceland Basin and Irminger Sea, where air and water temperatures are more like 6-8 degC. And fog is almost everywhere. Suddenly you don’t see anyone on deck anymore unless they have to be.
The graph below shows the longitude along our track and the corresponding surface air and water temperatures. We started in the central Iceland Basin near 25 degE and first worked our way over to the coast of Scotland (~July 8th) and then headed back across the Iceland Basin and into the Irminger Sea where we are now. Just remarkable how similar these three curves are.


We have an outstanding group of scientists on this trip, and I would like to highlight here especially the fantastic group of students who have joined us and are contributing greatly to our mission. The pictures below show them hard at work on their various watch duties, seemingly enjoying the experience (or at least faking it really well).
-
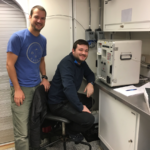
- University of Miami graduate students Greg Koman and Tiago Bilo running some salinity samples. (NB: its not really as fun as they are making it look.)
-
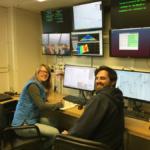
- Utrecht University graduate student David Wichmann, with SAMS ocean chemist Jeanne Castille.
-
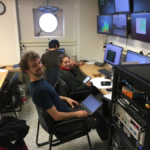
- Graduate students Roos Bol from NIOZ (left) and James Coogan from SAMS (right), at the CTD computer console.
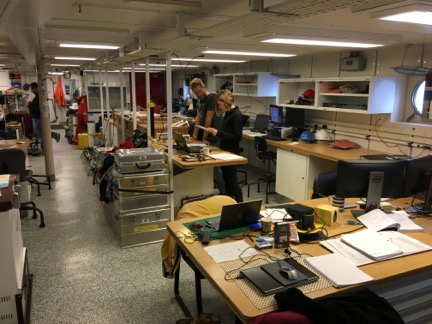
Below are some other assorted photos from the cruise showing the science labs and work taking place on deck.
-
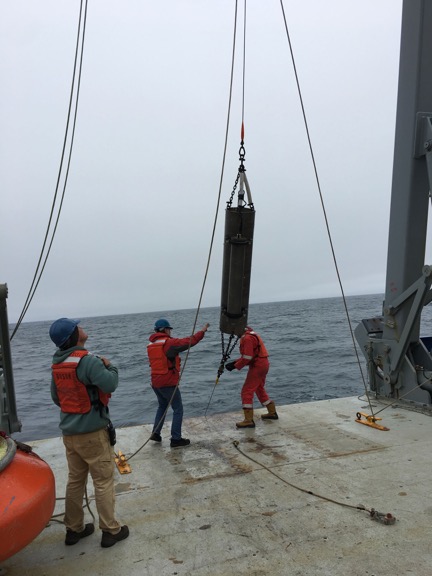
- Recovery of a “sound source” for the acoustically tracked RAFOS floats deployed during OSNAP. Not in bad shape after four years in the water! (From left to right: R/V Armstrong bos’n Scott Loweth, U. Miami mooring technician Mark Graham, and NOC mooring technician Robert McLachlan.)
-
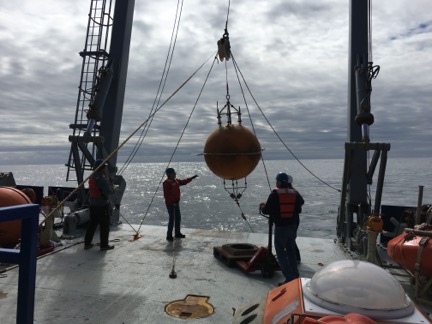
- A mooring top float coming aboard in an early morning recovery.
-
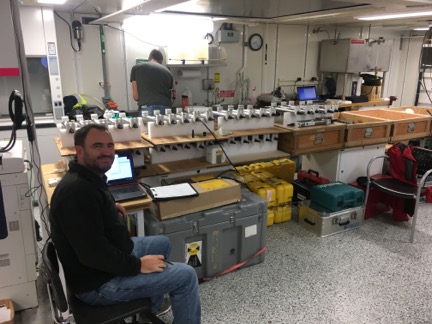
- U. Miami mooring technician Adam Houk with all his “ducks” (SeaBird micocats) in a row.
-

- NOC mooring technician Chris Crow preparing instruments for deployment.
-
- Femke de Jong and NIOZ mooring technician Lorenz Boom in the main lab discussing upcoming mooring operations.
-
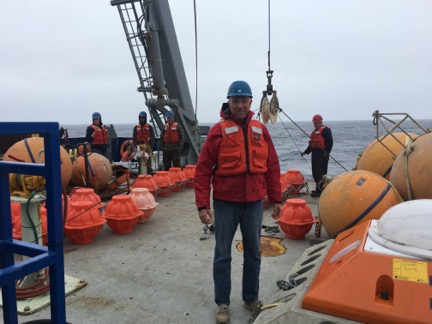
- Yours truly on deck trying to look like I am actually doing something worthwhile.